- Published on
NQ and QQQ: A Fibonacci Retracement Analysis
- Authors

- Name
- Michael W. Clark
- @MichaelW_Clark
NQ and QQQ: Fibonacci Retracement and Market Strategy
As the market retracts from its recent upward trajectory since March 5th, we find ourselves at a pivotal juncture, closely monitoring potential inflection points derived from Fibonacci retracement levels for NQ and QQQ. The near-complete retracement of the move up presents a unique opportunity for discerning traders to anticipate the market's next phase.
NQ Analysis: Key Fibonacci Levels and Gap Watch
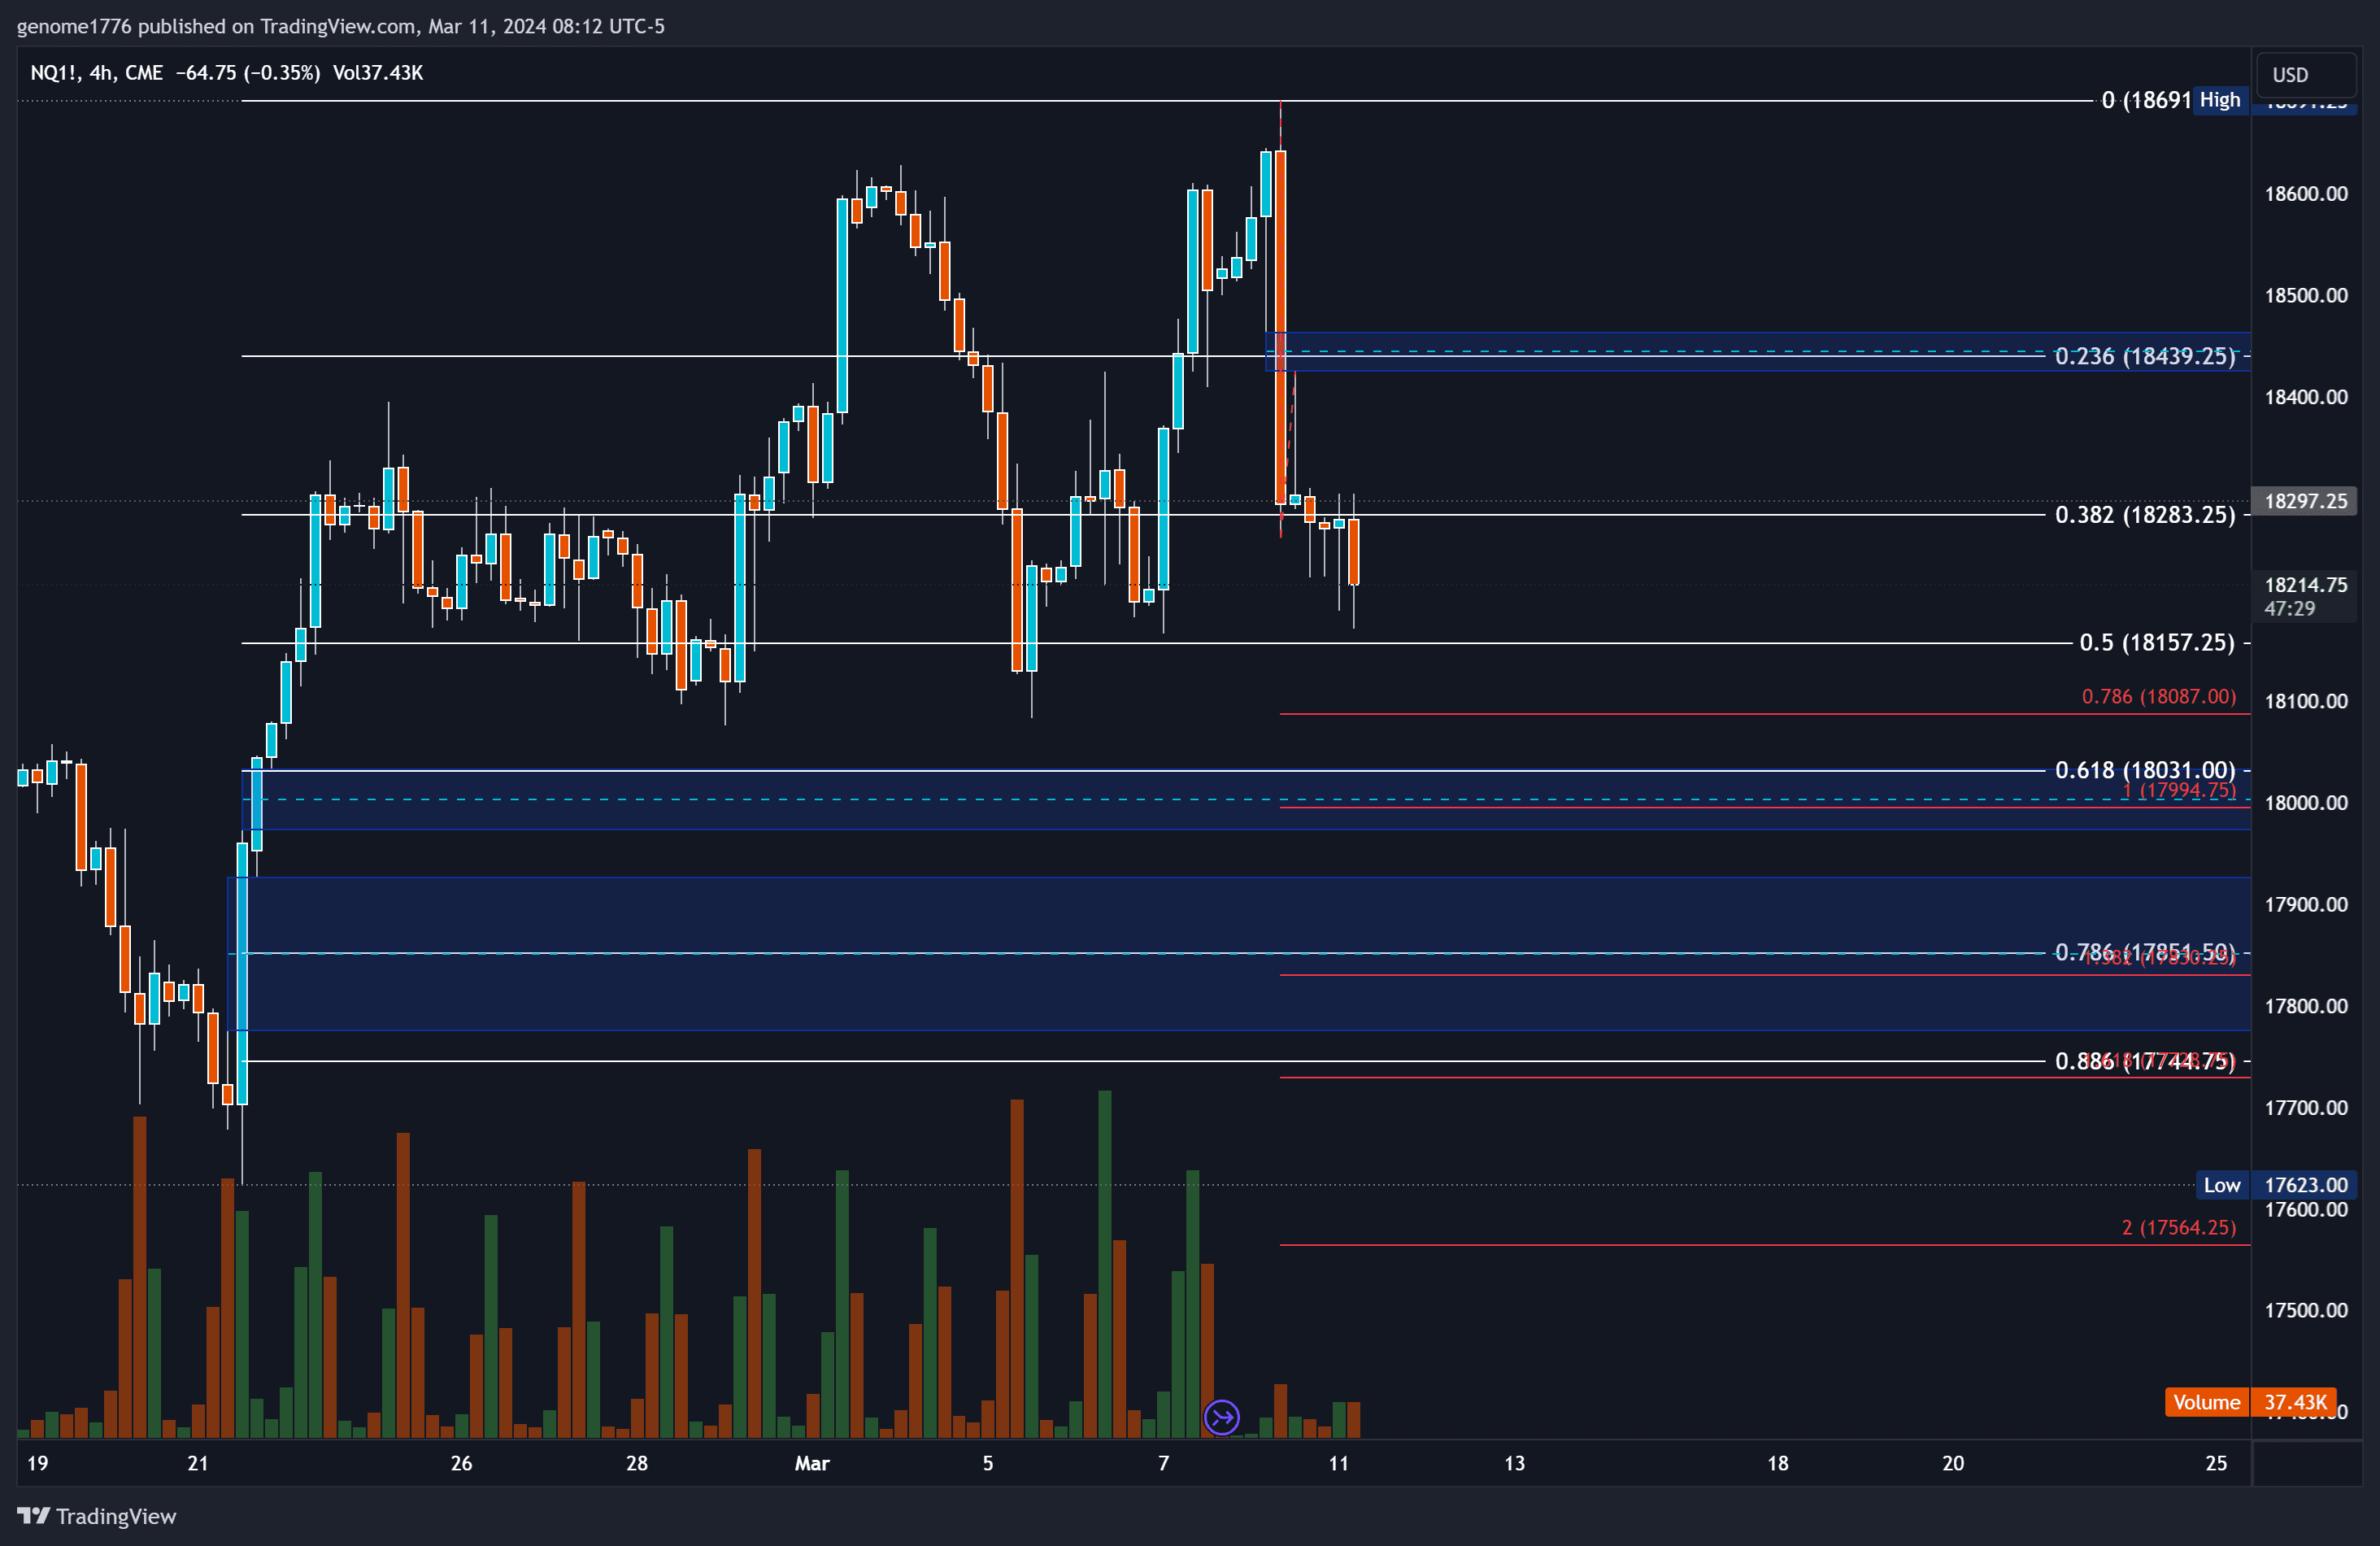
NQ's retracement has nearly erased the gains from early March, bringing our attention to potential starting points for a new wave upwards, particularly around the 18031 and 17851.50 marks. However, traders should remain cautious of the topside gap near the .236 fib level at 18439.25, which could influence short-term market direction.
NQ Fibonacci Retracements
- .236: 18439.25
- .382: 18283.25
- .5: 18157.25
- .618: 18031.00
- .786: 17851.50
- .886: 17744.75
Falling below the .886 level necessitates a reevaluation towards considering a larger corrective wave in play. A breach below the 421.64 low would confirm a bearish downtrend.

QQQ Fibonacci Retracements: Identifying Potential Reversals
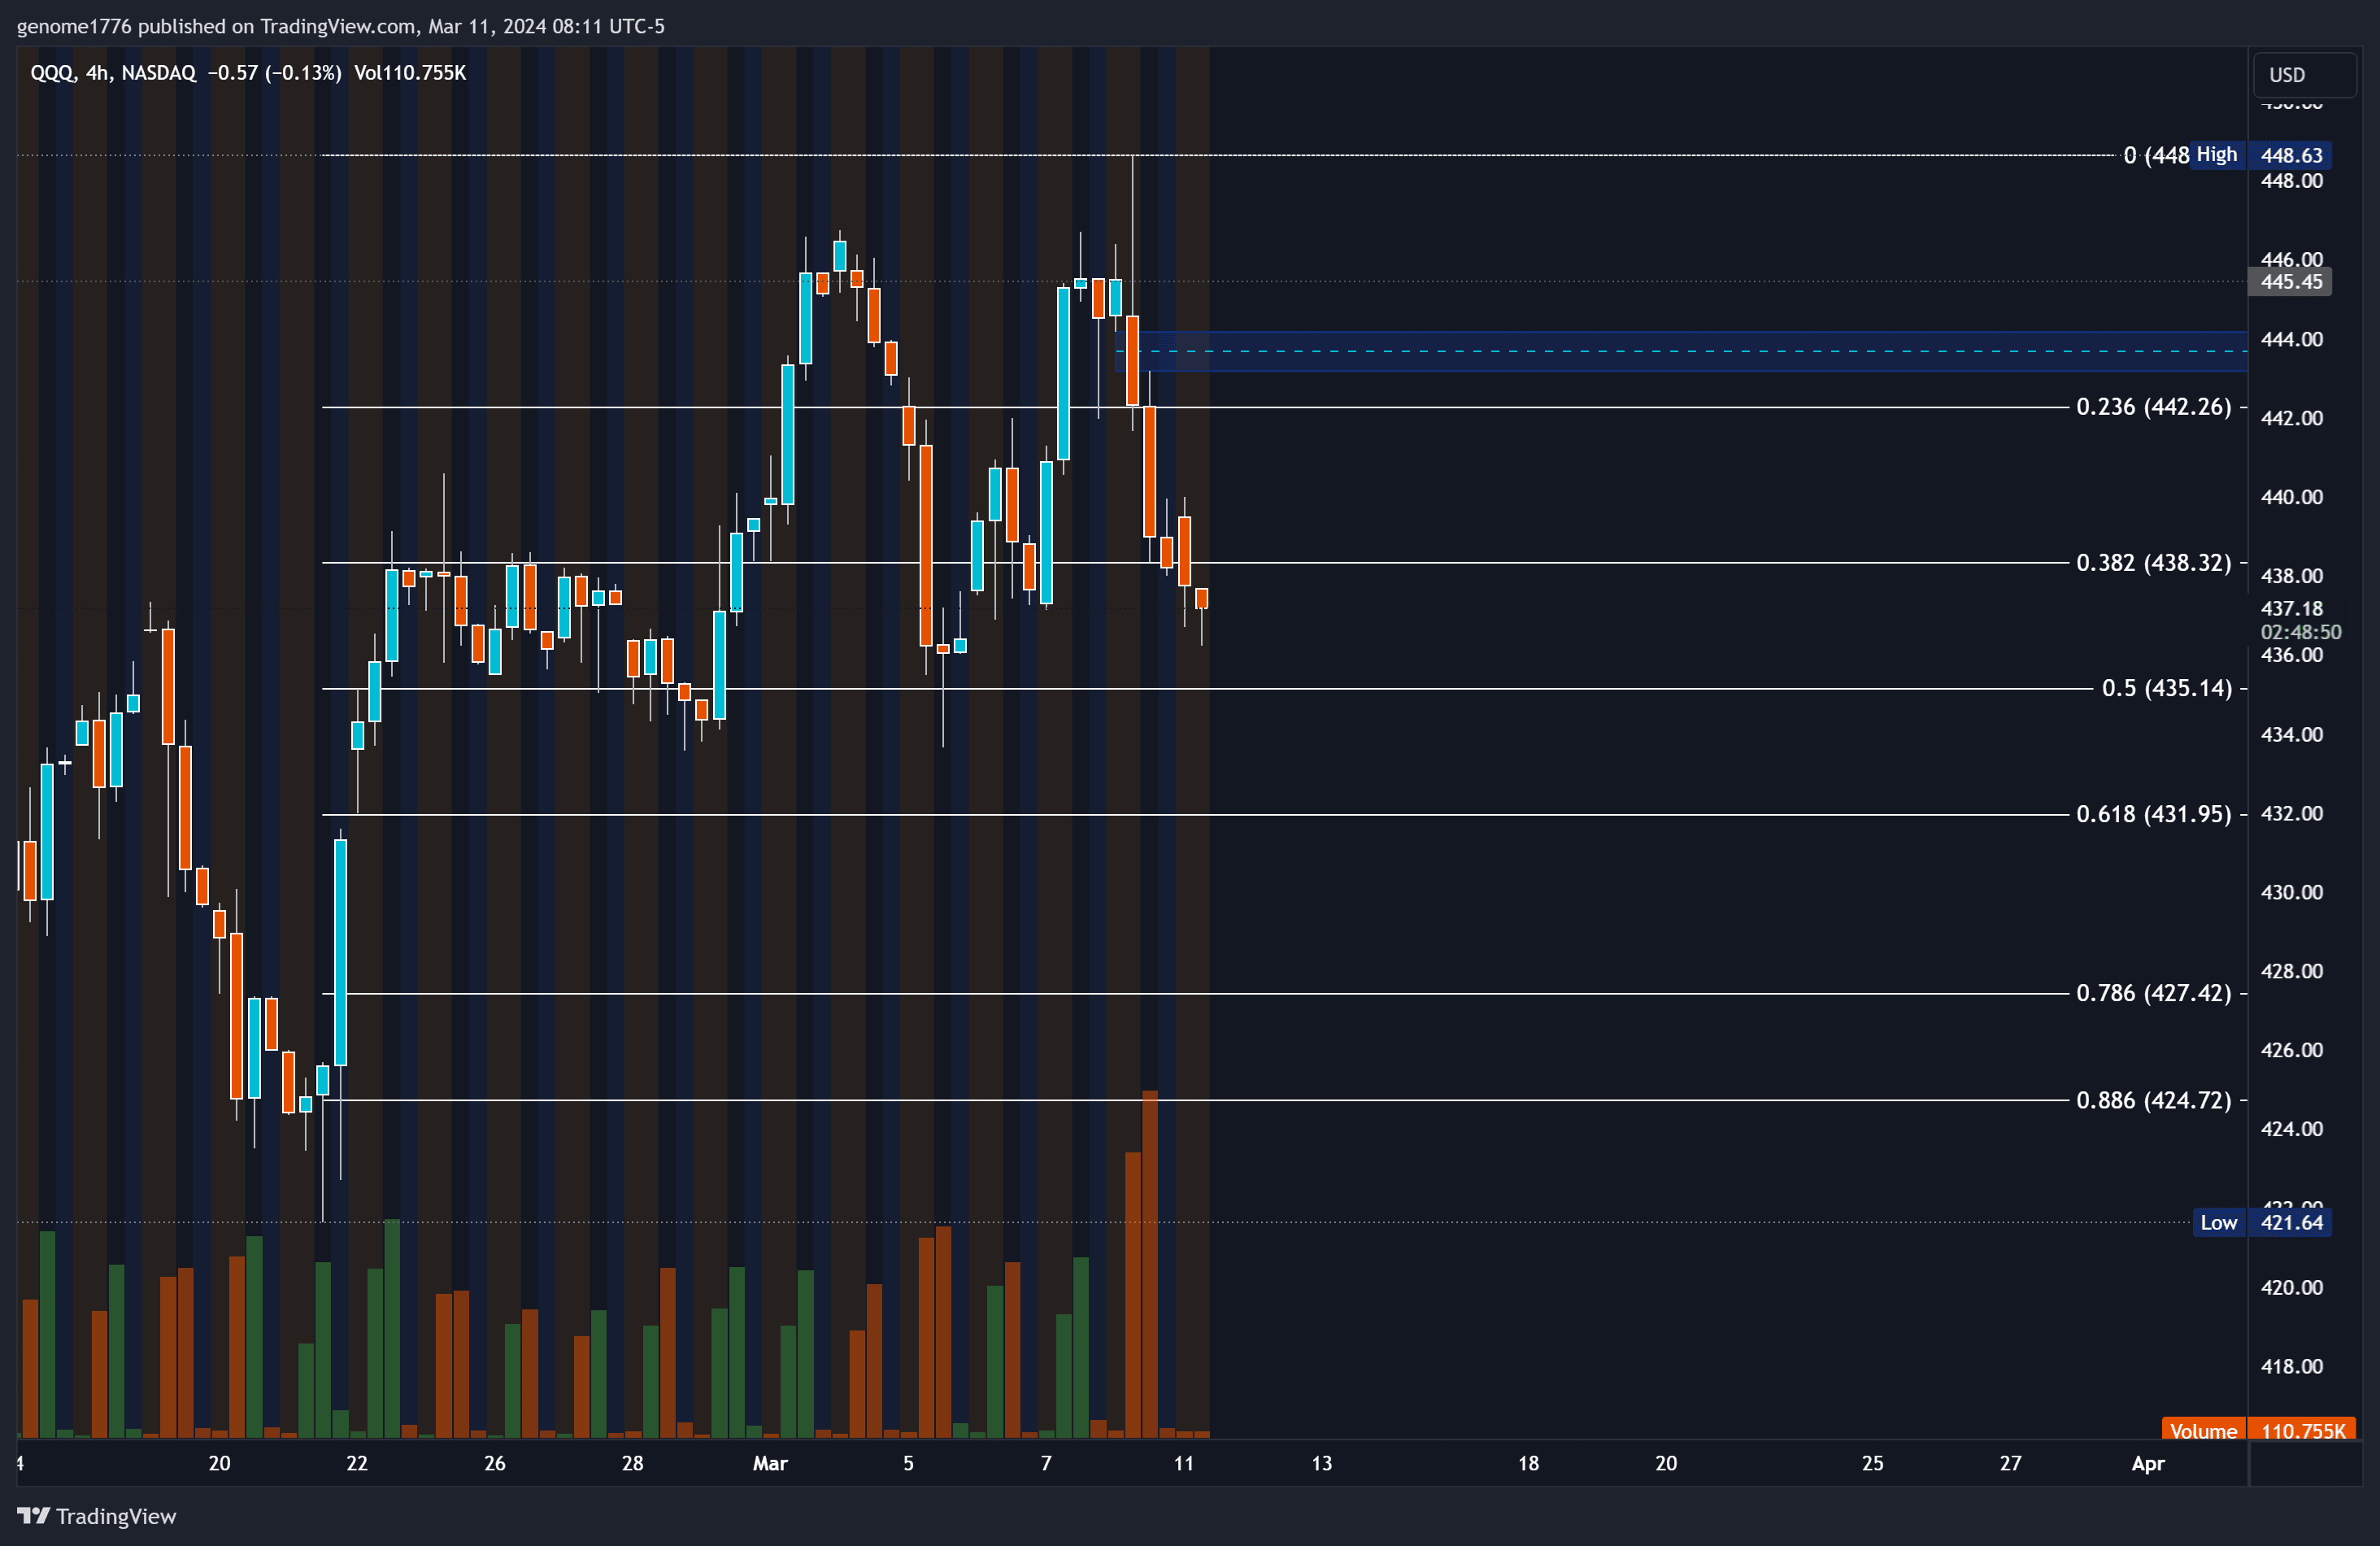
QQQ presents a similar narrative with its own Fibonacci retracement levels to watch, as well as a notable topside gap in the 443.70 area, suggesting potential resistance or reversal zones.
QQQ Fibonacci Retracements
- .236: 442.26
- .382: 438.32
- .5: 435.14
- .618: 431.95
- .786: 427.42
- .886: 424.72

Today's Trading Plan
Initial Observations
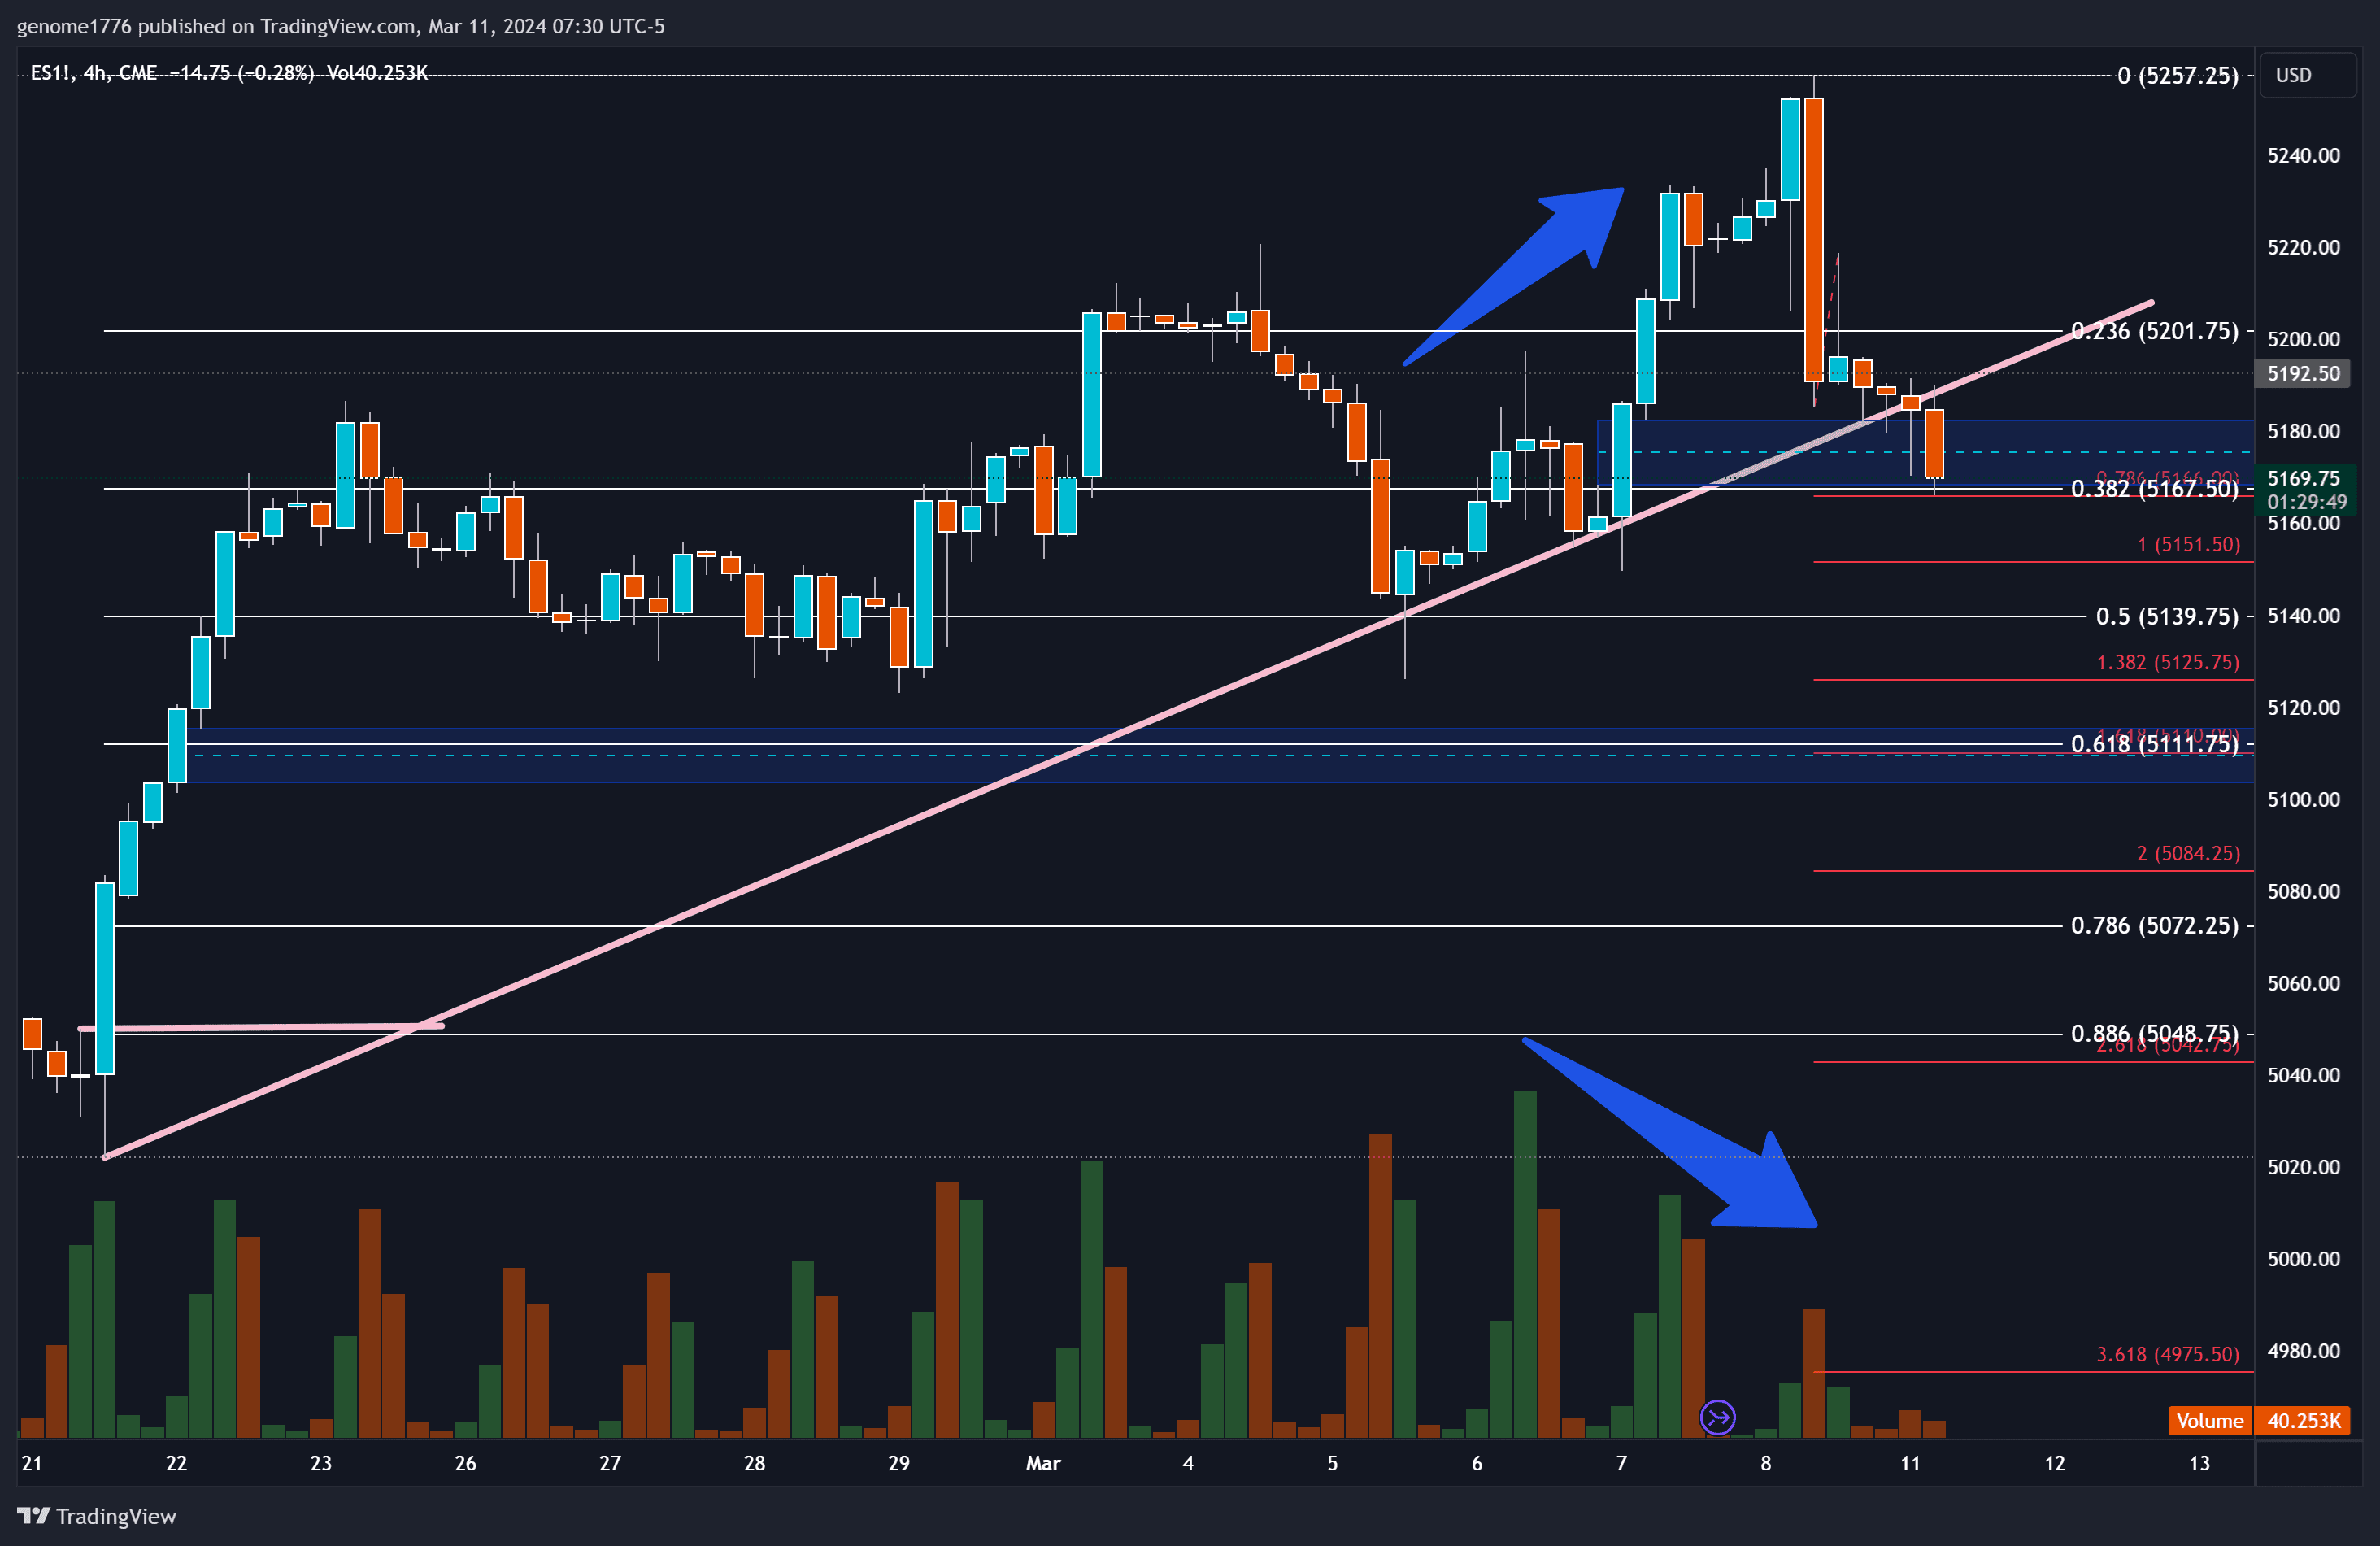
The early trading phase will be crucial to discern whether we can pivot away from the current levels. With ES indicating a bullish gap, there's potential for either a retracement or the initiation of a new upward wave, confirmable at new highs but projectable once we've ascended and successfully held above recent lows.
Strategic Moves
- Topside Gap Reaction: A strong reaction from the topside gap could lead to short positions targeting the .618 level within 2-3 days.
- Downward Pressure: Should the descent continue, keen observation of reactions at lower Fibonacci levels will be vital, with an eye for opportunistic long scalps guided by Volume Price Analysis (VPA) and identified market gaps.
Note on Trendline Breaks
We have observed a break of the 4-hour trendline to the downside in NQ, a pattern often followed by a retest of the trendline before a potential further decline. This adds another layer of complexity to our analysis and warrants close monitoring for signs of retest and subsequent market behavior.
Risk Management
Today's strategy emphasizes caution, prioritizing a clear understanding of current wave counts and market reactions before committing to positions. This measured approach seeks to navigate the intricate wave patterns and potential shifts with precision.
Conclusion
The unfolding market dynamics between NQ and QQQ, framed by Fibonacci retracement levels and recent trendline breaks, offer a nuanced view of potential market reversals. Today's focus will be on identifying and acting upon these critical points with a strategy that balances opportunistic trades with stringent risk management. The journey through these Fibonacci landscapes and beyond will require vigilance and adaptability as we chart our course through the market's ebb and flow.
