- Published on
Identifying 1 Fib Failures vs Pivots
- Authors

- Name
- Michael W. Clark
- @MichaelW_Clark
A Simply Options member recently asked how I was able to predict a 1 Fibonacci extension failing rather than serving as a pivot point for a reversal.
This is an excellent question and presents a great opportunity to delve more deeply into my daily strategy. Without further ado, let's explore how I managed to predict deeper lows on March 15th and capture 500% gains in 0dte puts.
To understand my projections for further downside, we must look back a few days. On March 8th, we experienced a very turbulent day. The morning session reached a new all-time high, followed immediately by a sharp downturn. This quick and violent movement left a bearish imbalance (FVG) on QQQ/NQ, which has been the basis for all subsequent trades.
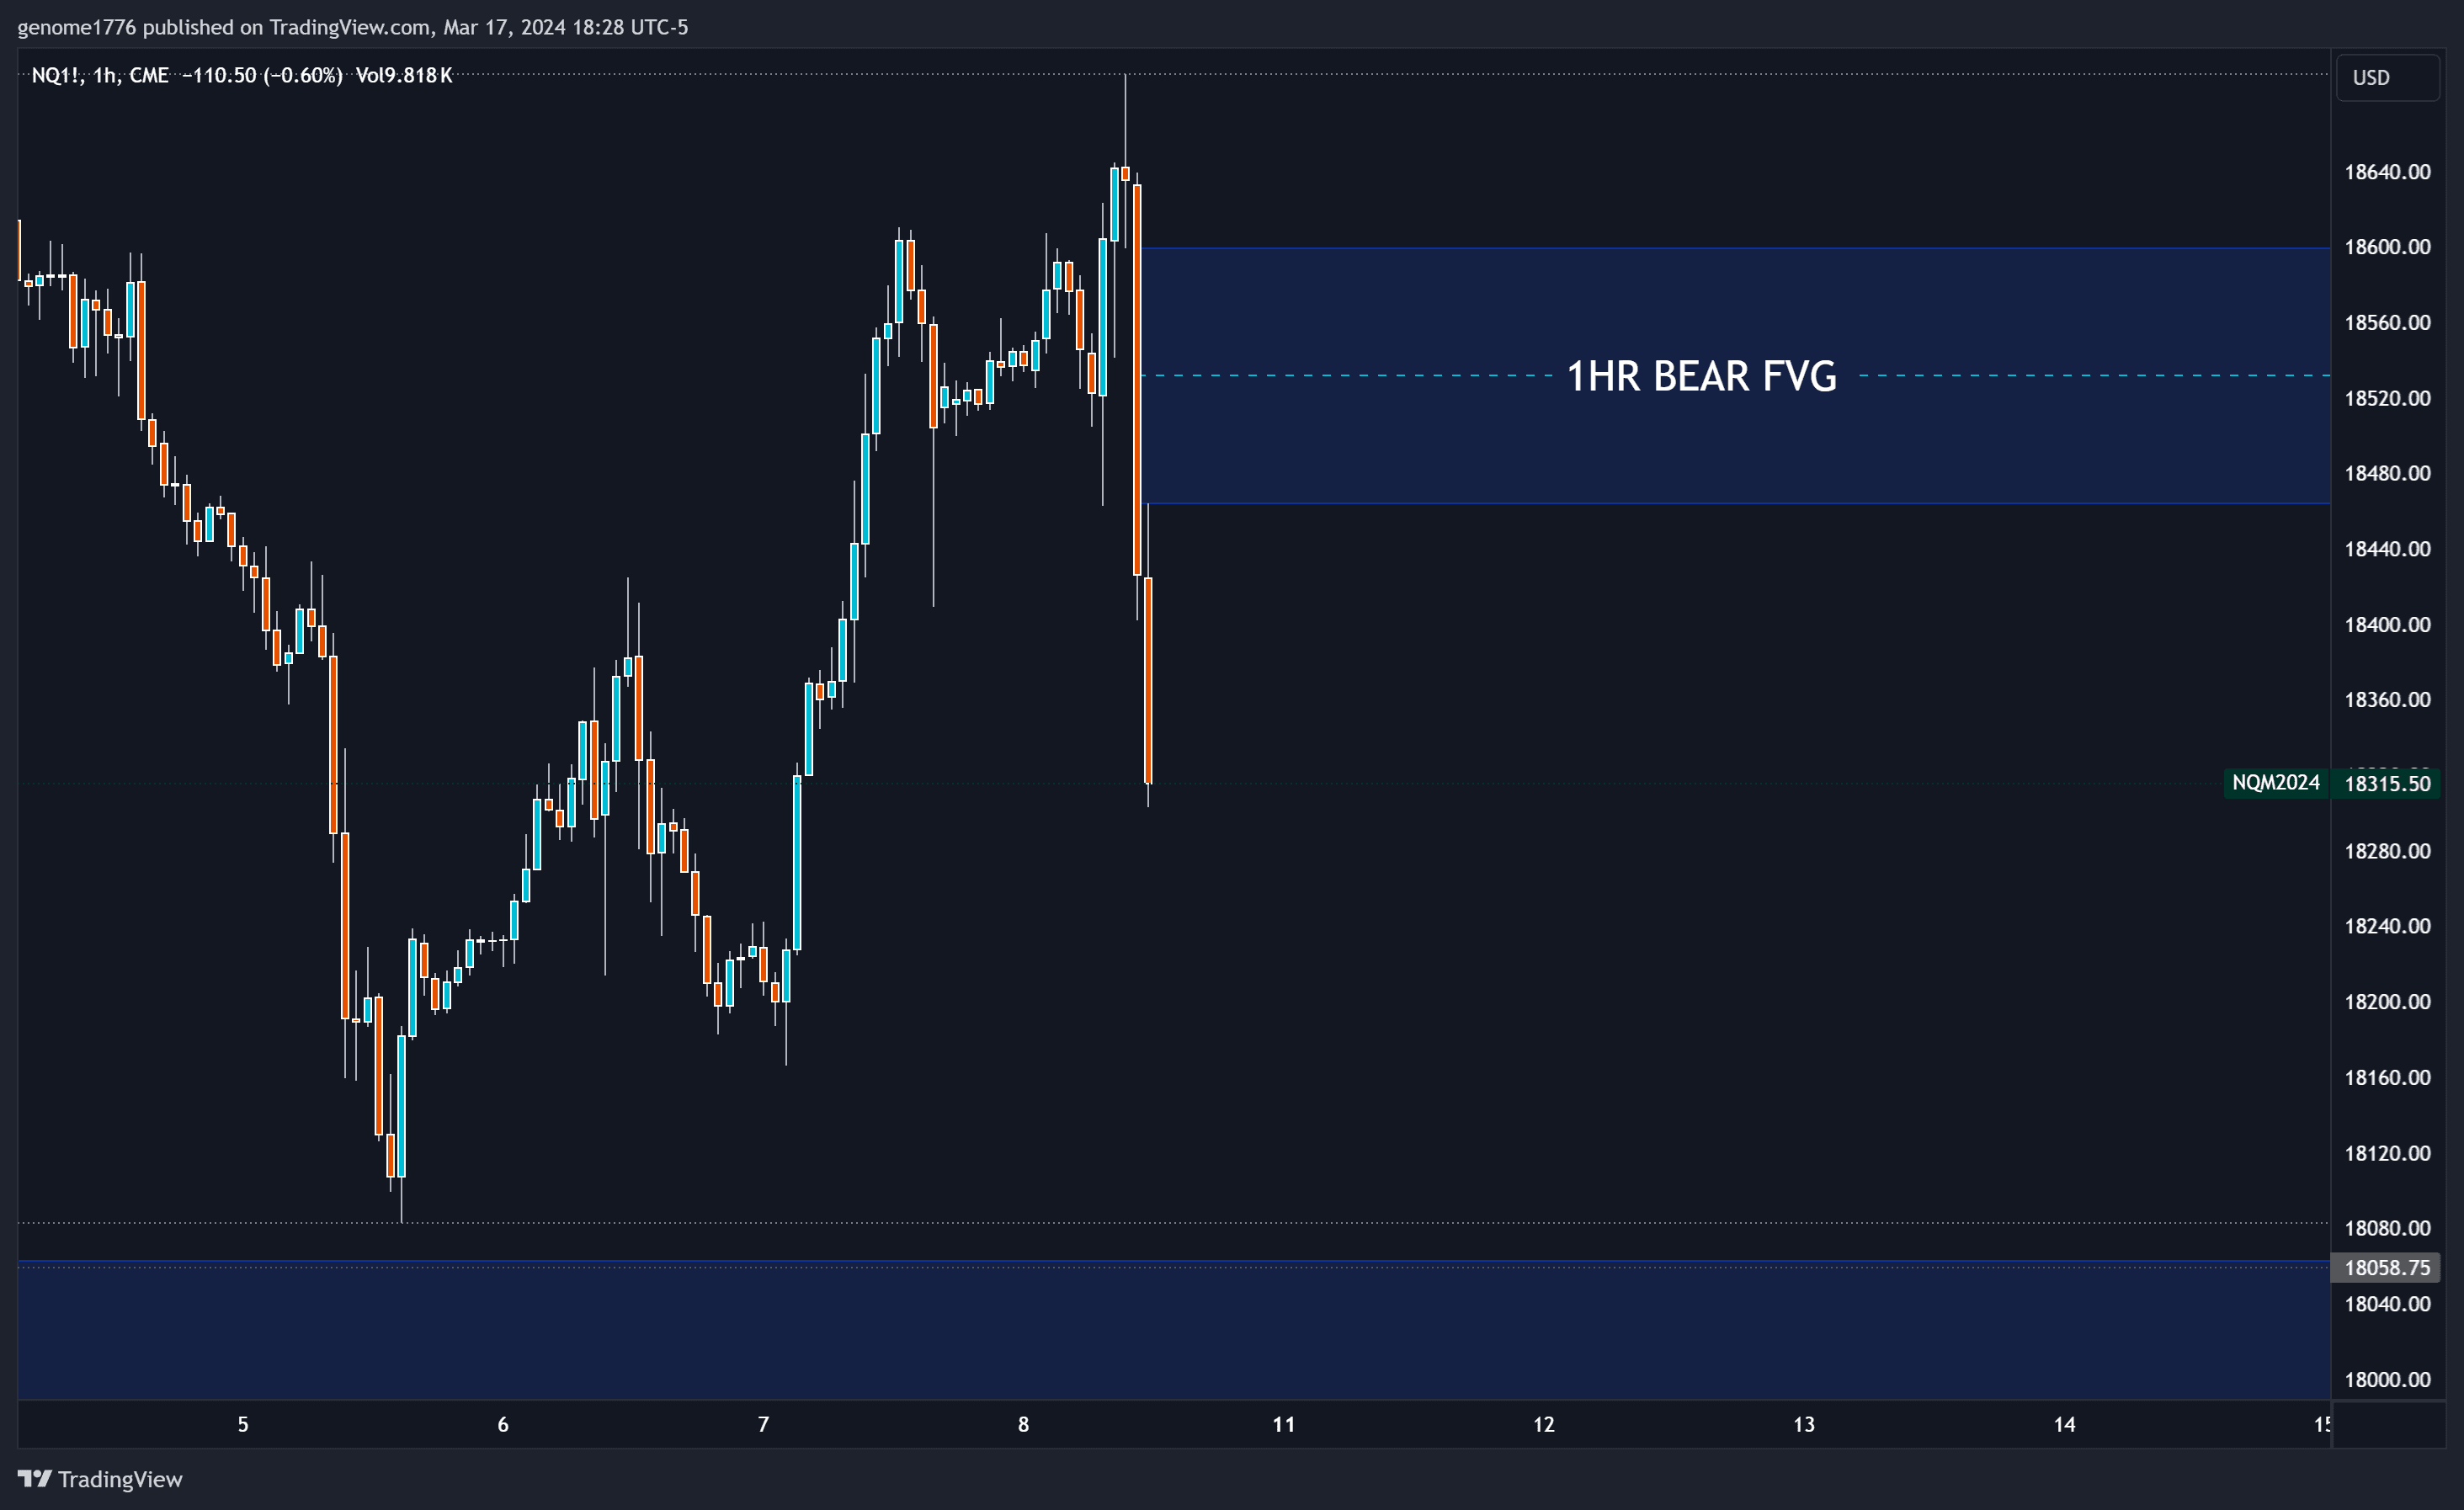
As mentioned in previous posts, FVGs are often retraced into before subsequently taking out the low/high that was set after the retrace. The low was marked early on March 11th and has been our target since, as a level we needed to surpass.
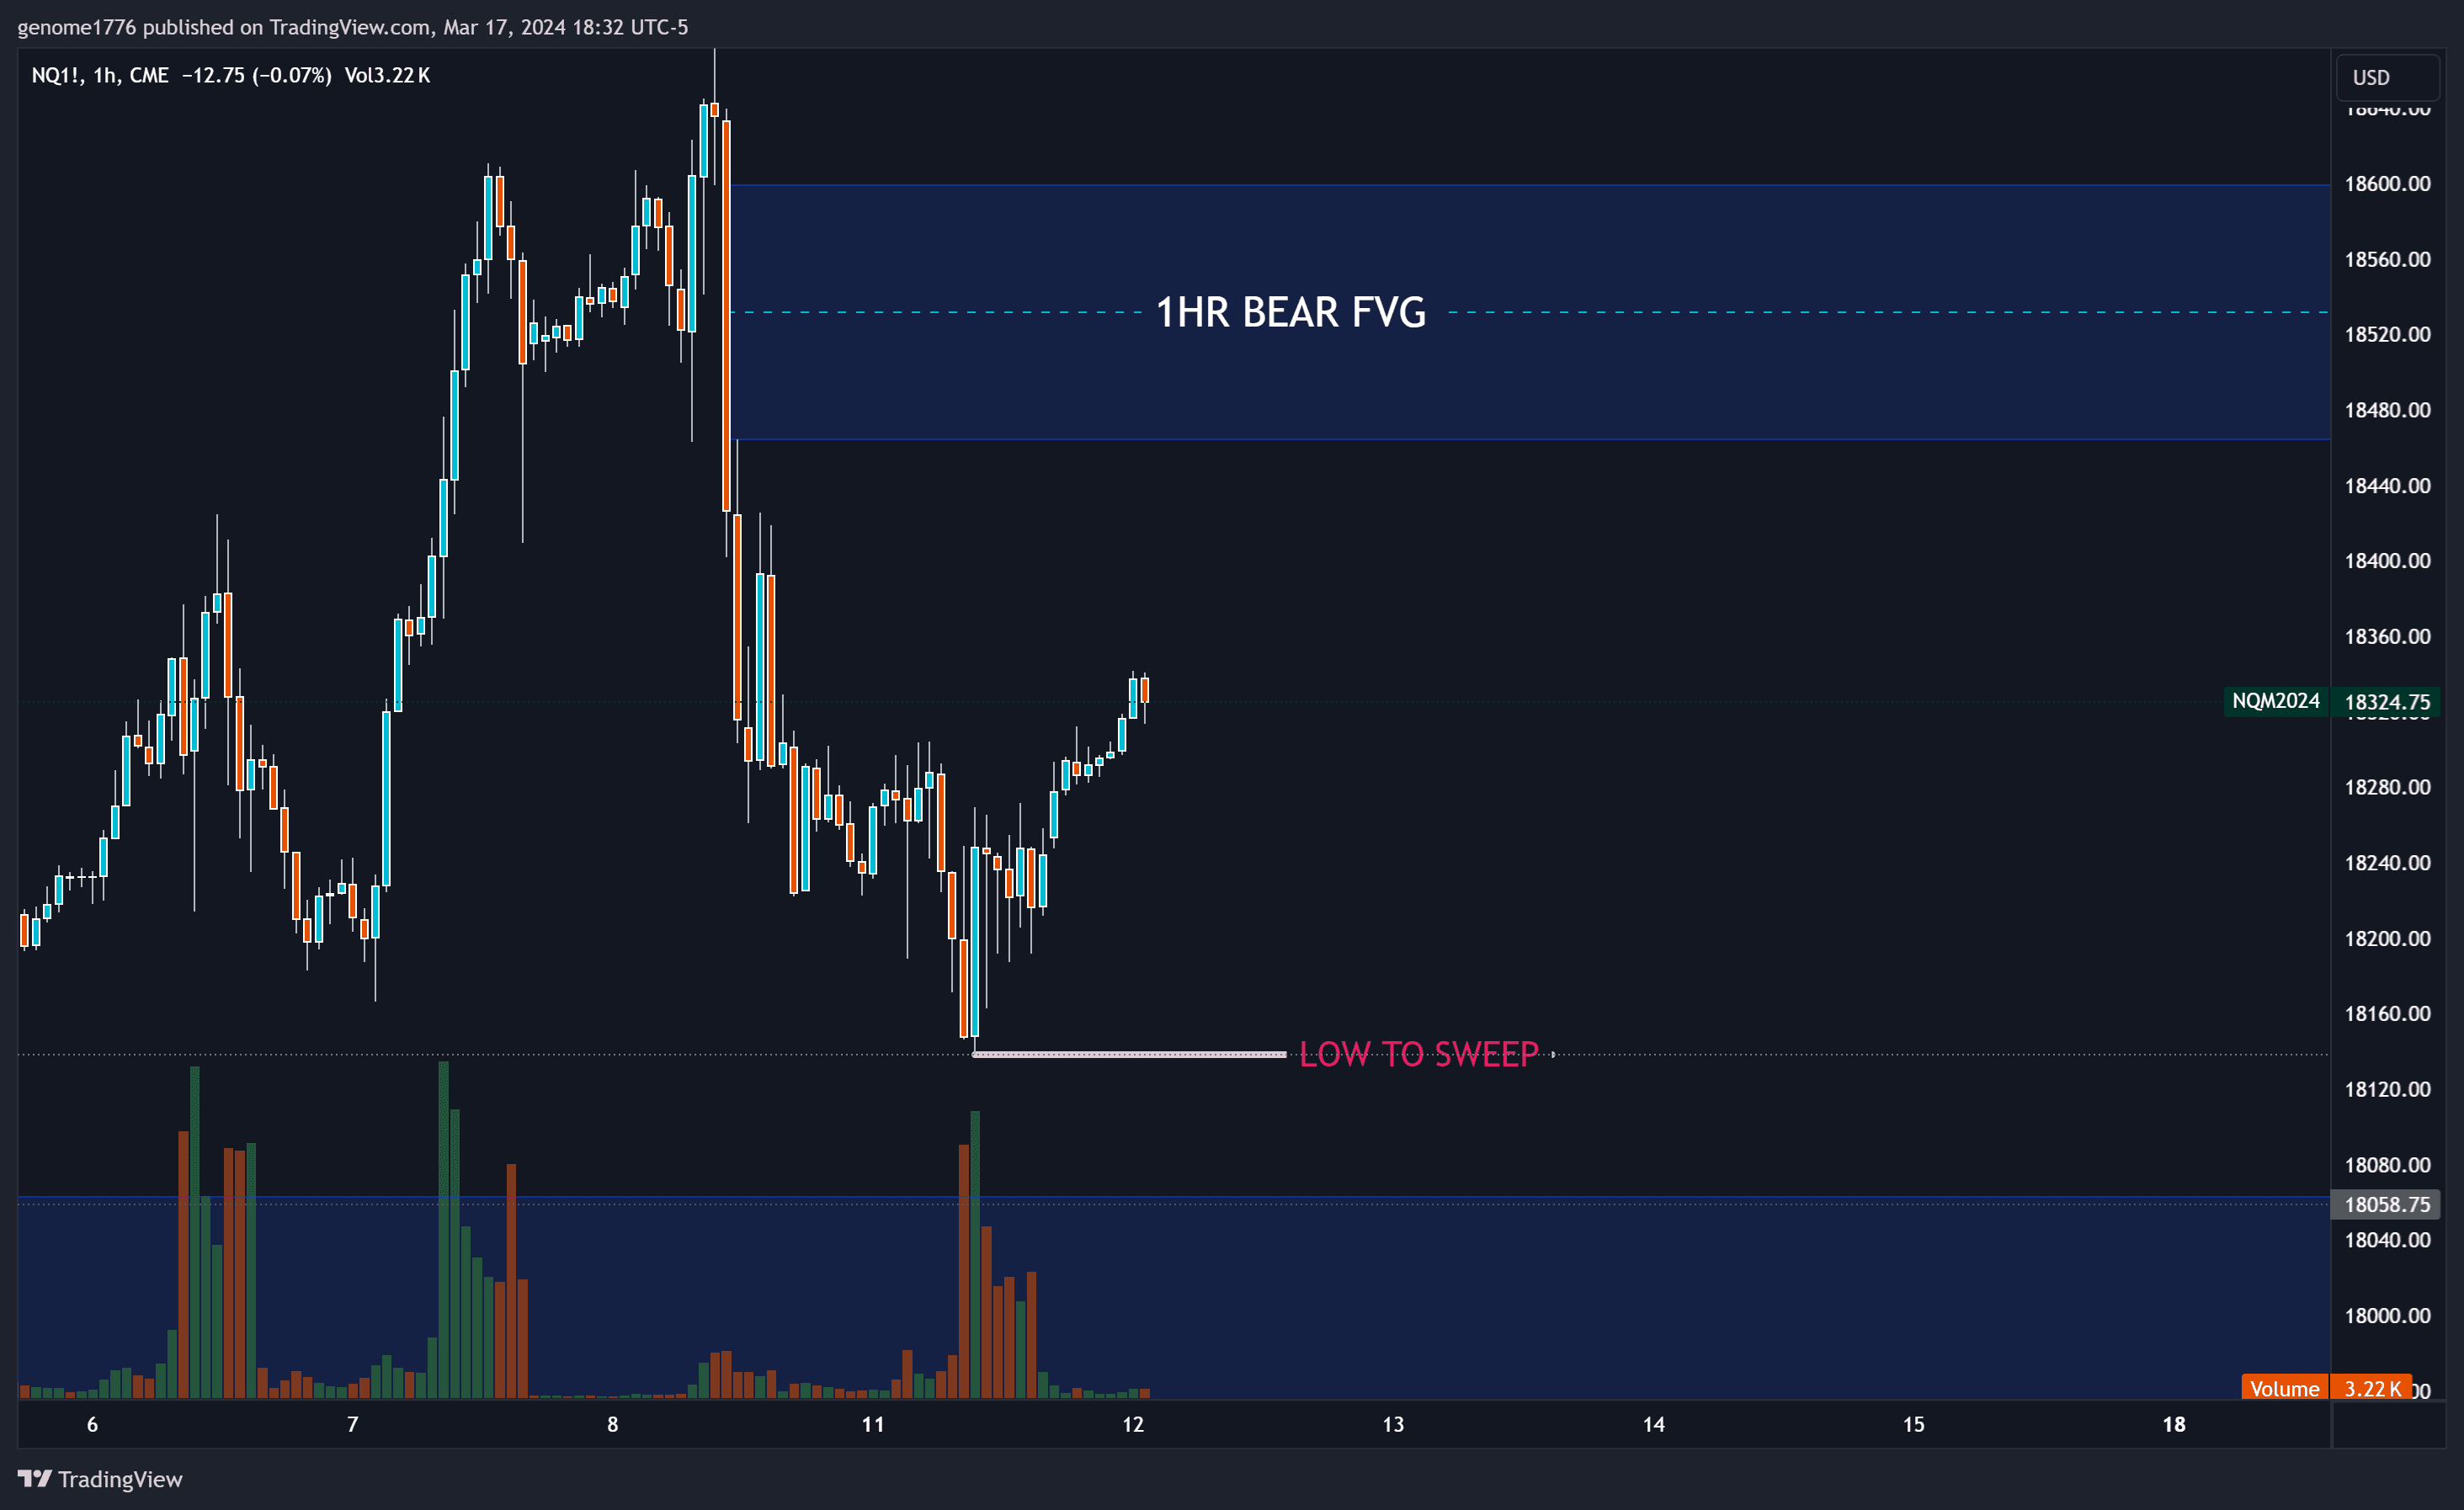
With our target set, we began to analyze the waves, specifically looking for targets downward after we retraced into our FVG and started back down on this 1hr timeframe. On March 13th, we pushed into the FVG and were right around the .618 Fibonacci, which is often the pivot point for a reversal. This level alone can be a strategy, offering more wins than losses if risk is managed appropriately.
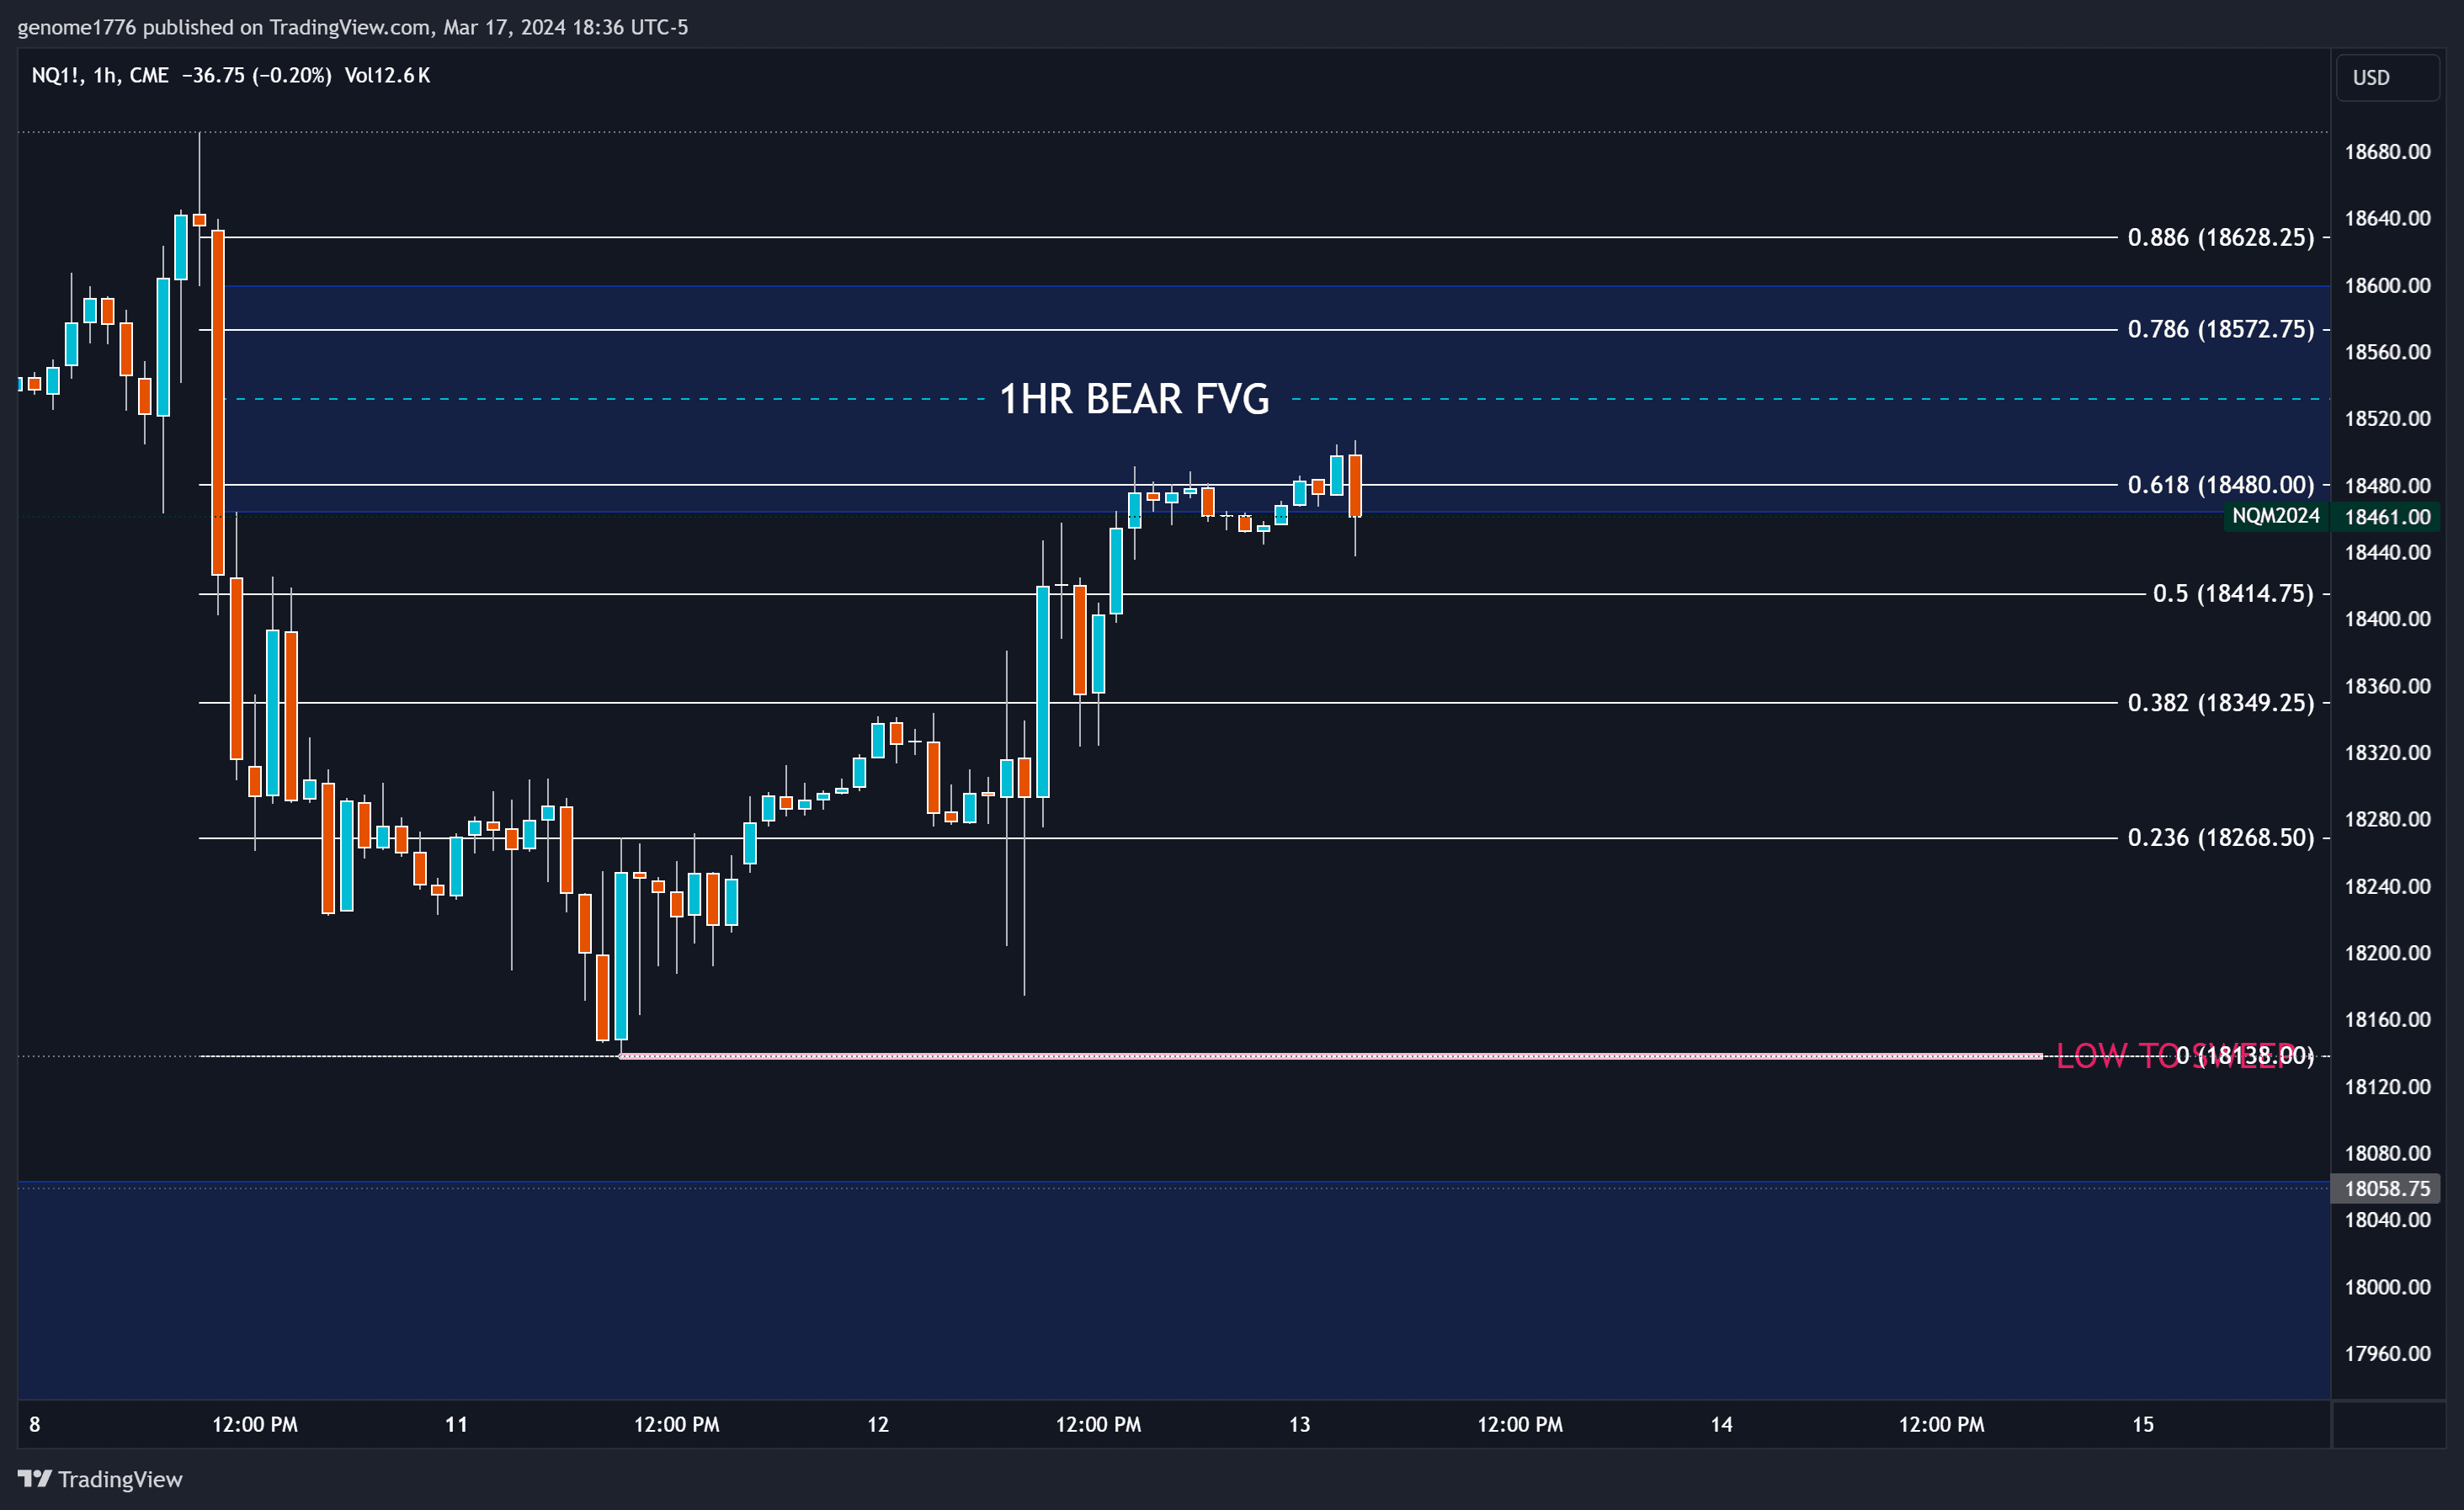
After slightly overshooting the .618, we took some risky puts and shorts that paid off well. I observed a three-wave retrace into the gap and .618, as well as a 1.618 extension after a data drop, forming my A+ setup and often leading to heavy entries. It paid off nicely for everyone who followed, with 500%+ on 0dte, and 100%+ on 3dte.
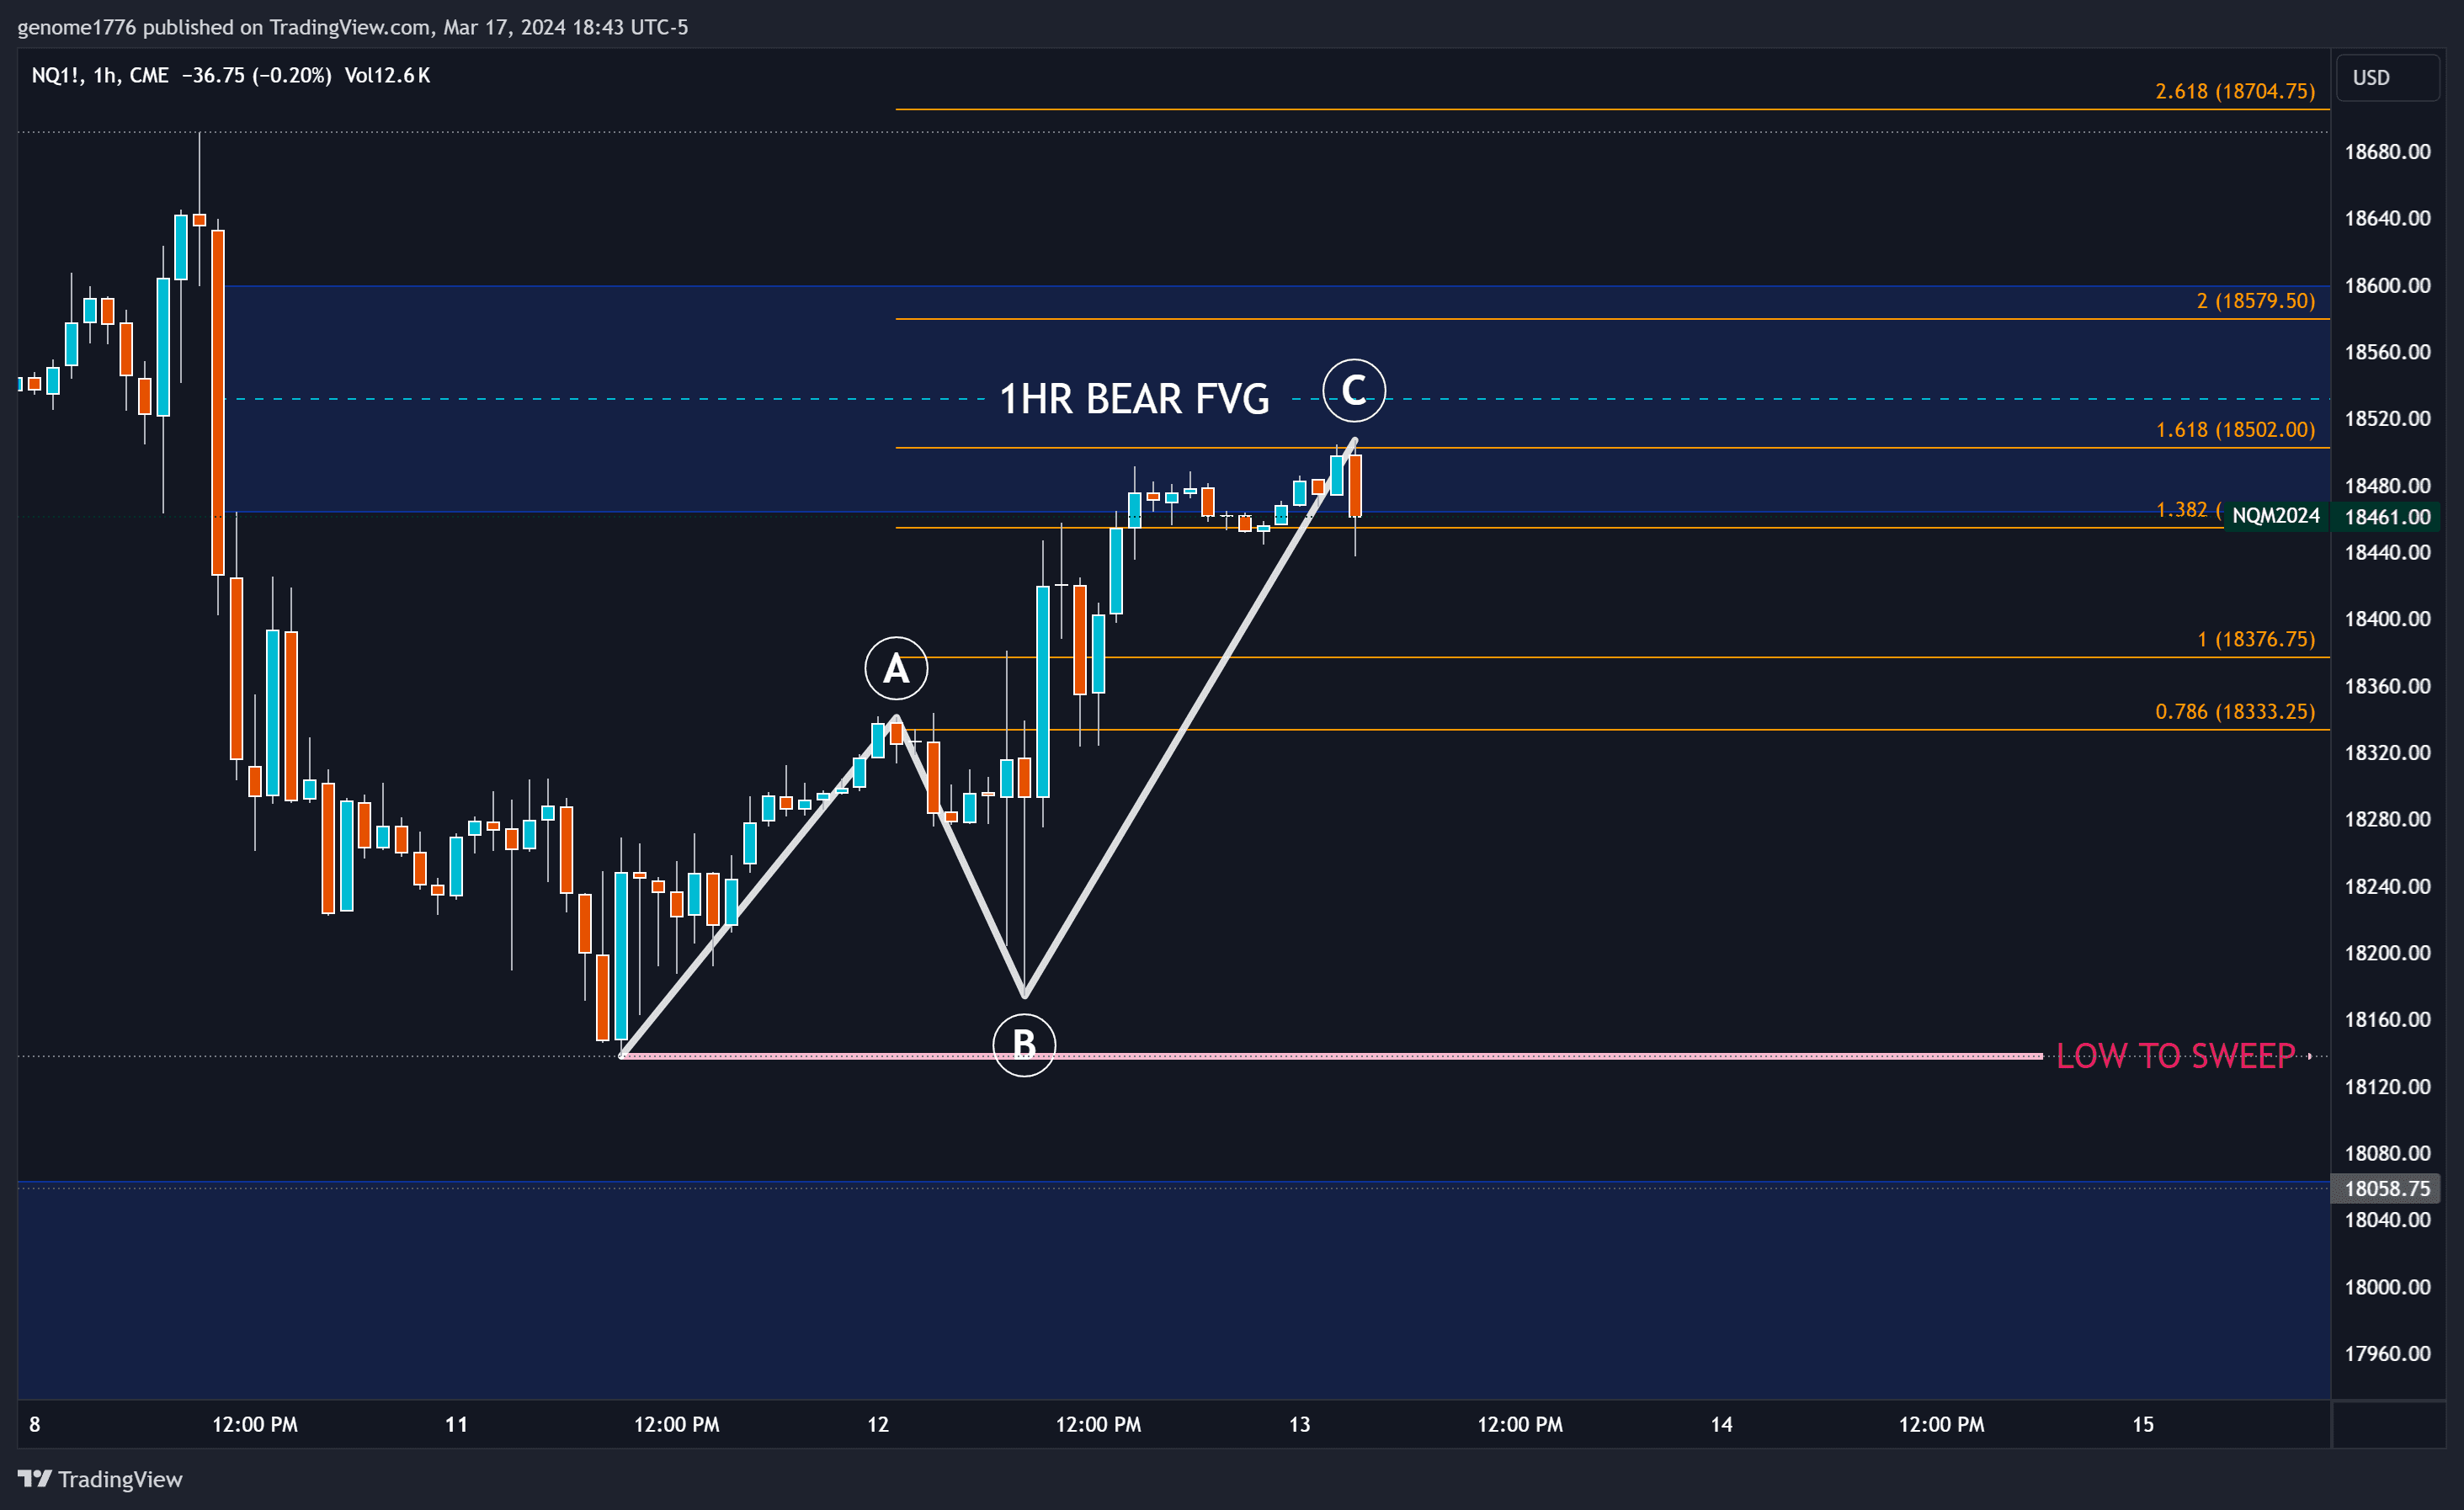
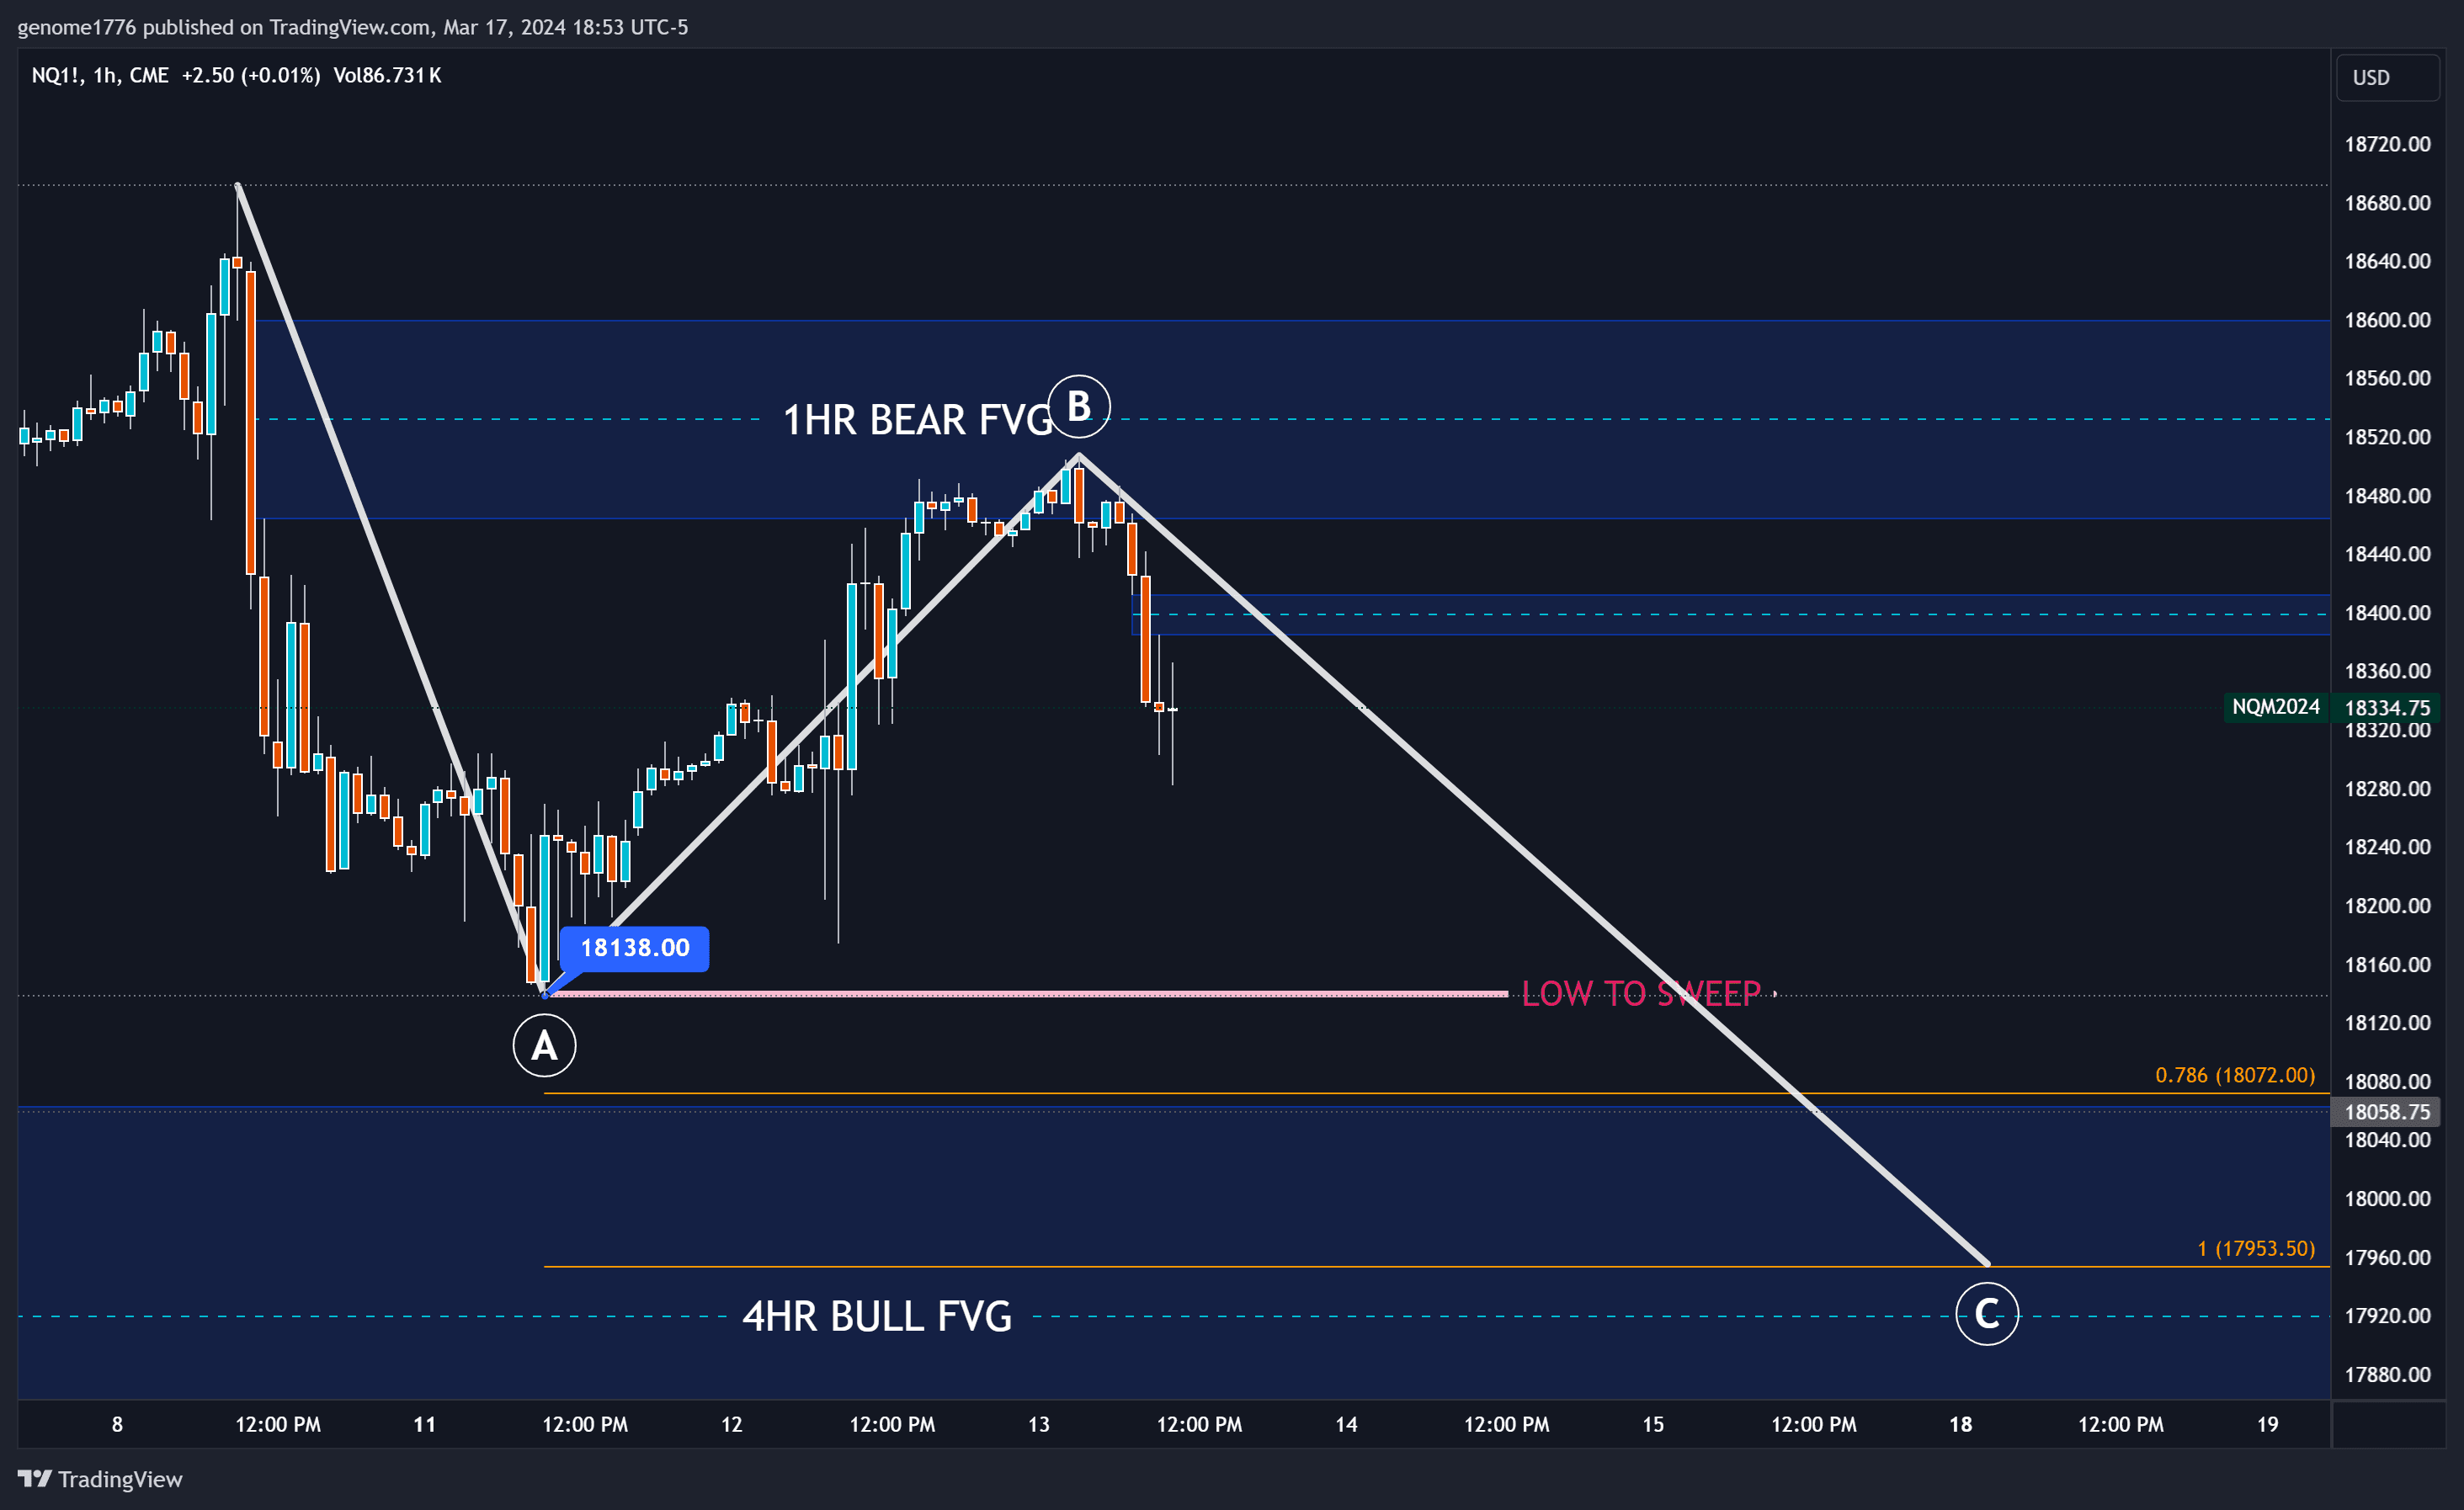
Others saw a five-wave move up, indicating a bigger high to come, but I noticed a more measured price movement with very few bullish imbalances as we entered the FVG. Only one imbalance at the top of the C wave was quickly taken out soon after, giving me further confidence that we would eventually take out the 18138 'low to sweep' line.
Later in the day on the 13th, we invalidated the only bullish gap left and observed some waves and a new bearish fair value gap.
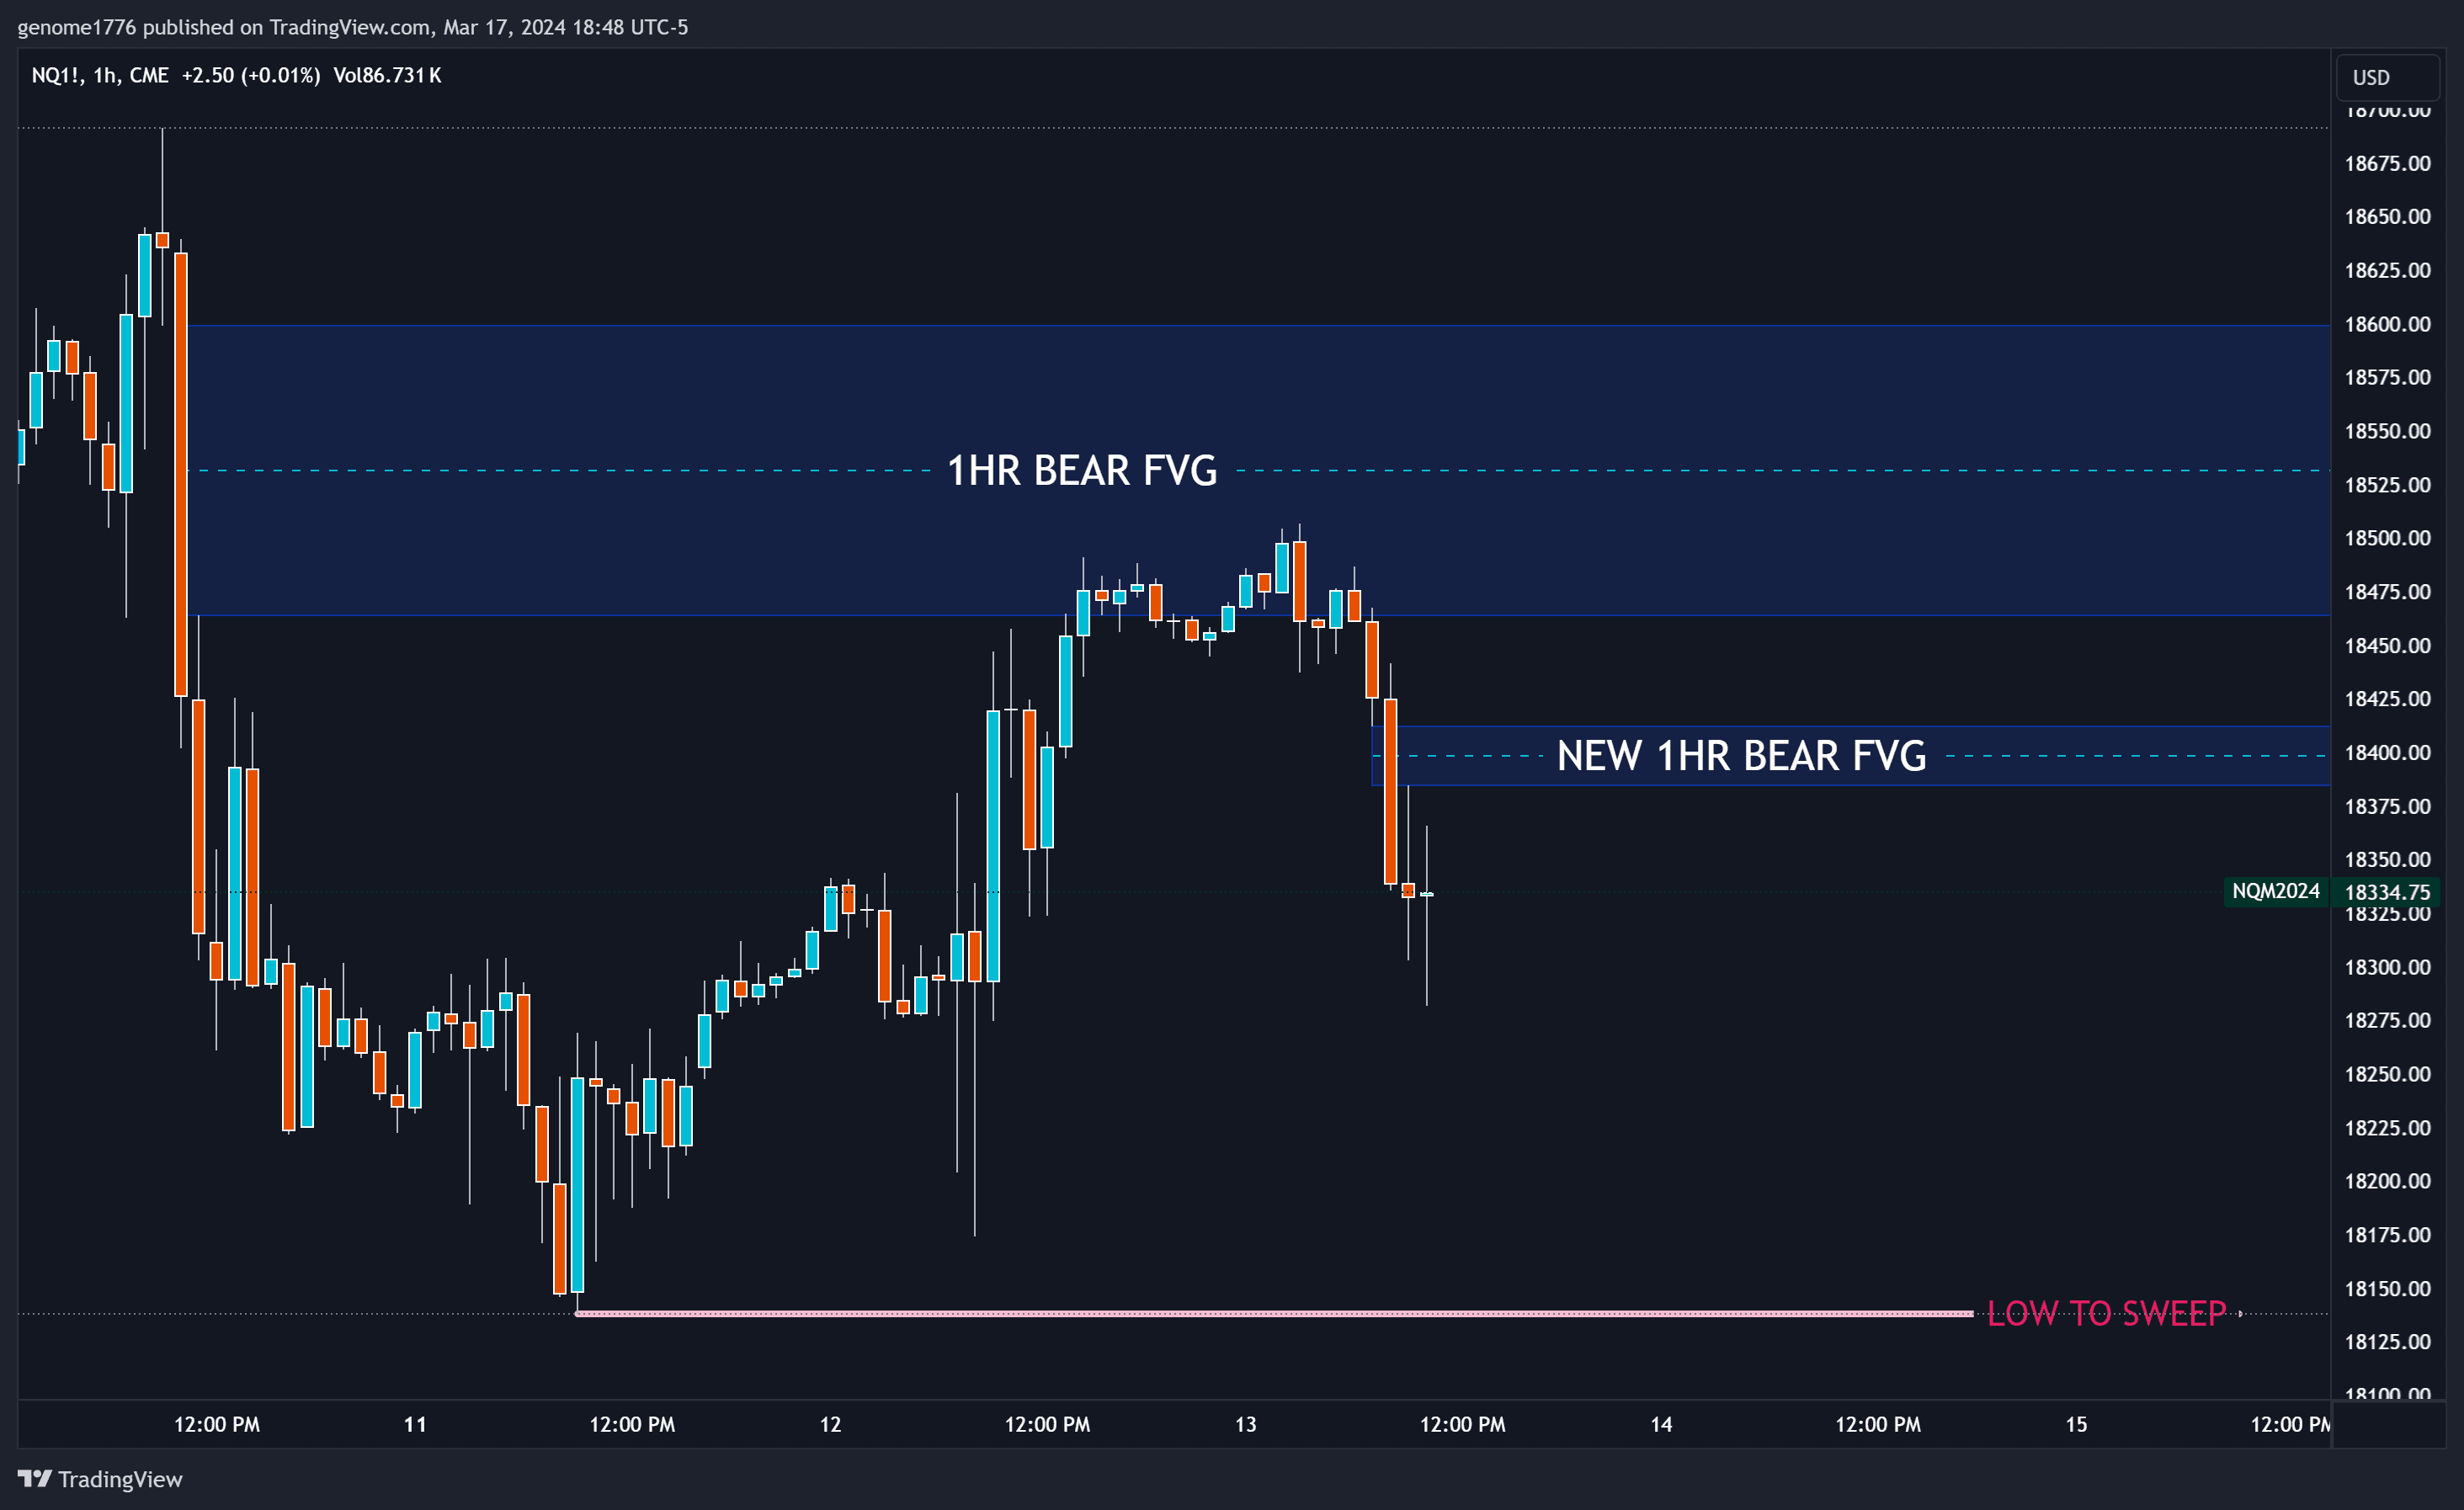
With this new gap set, we had a new low to track and began to see the start of a measurable wave on a smaller degree. Confident that a new wave down was starting, we looked at the larger wave extension to get our 1 Fibonacci target, with consideration for further extension once we held past the 1 Fibonacci level.
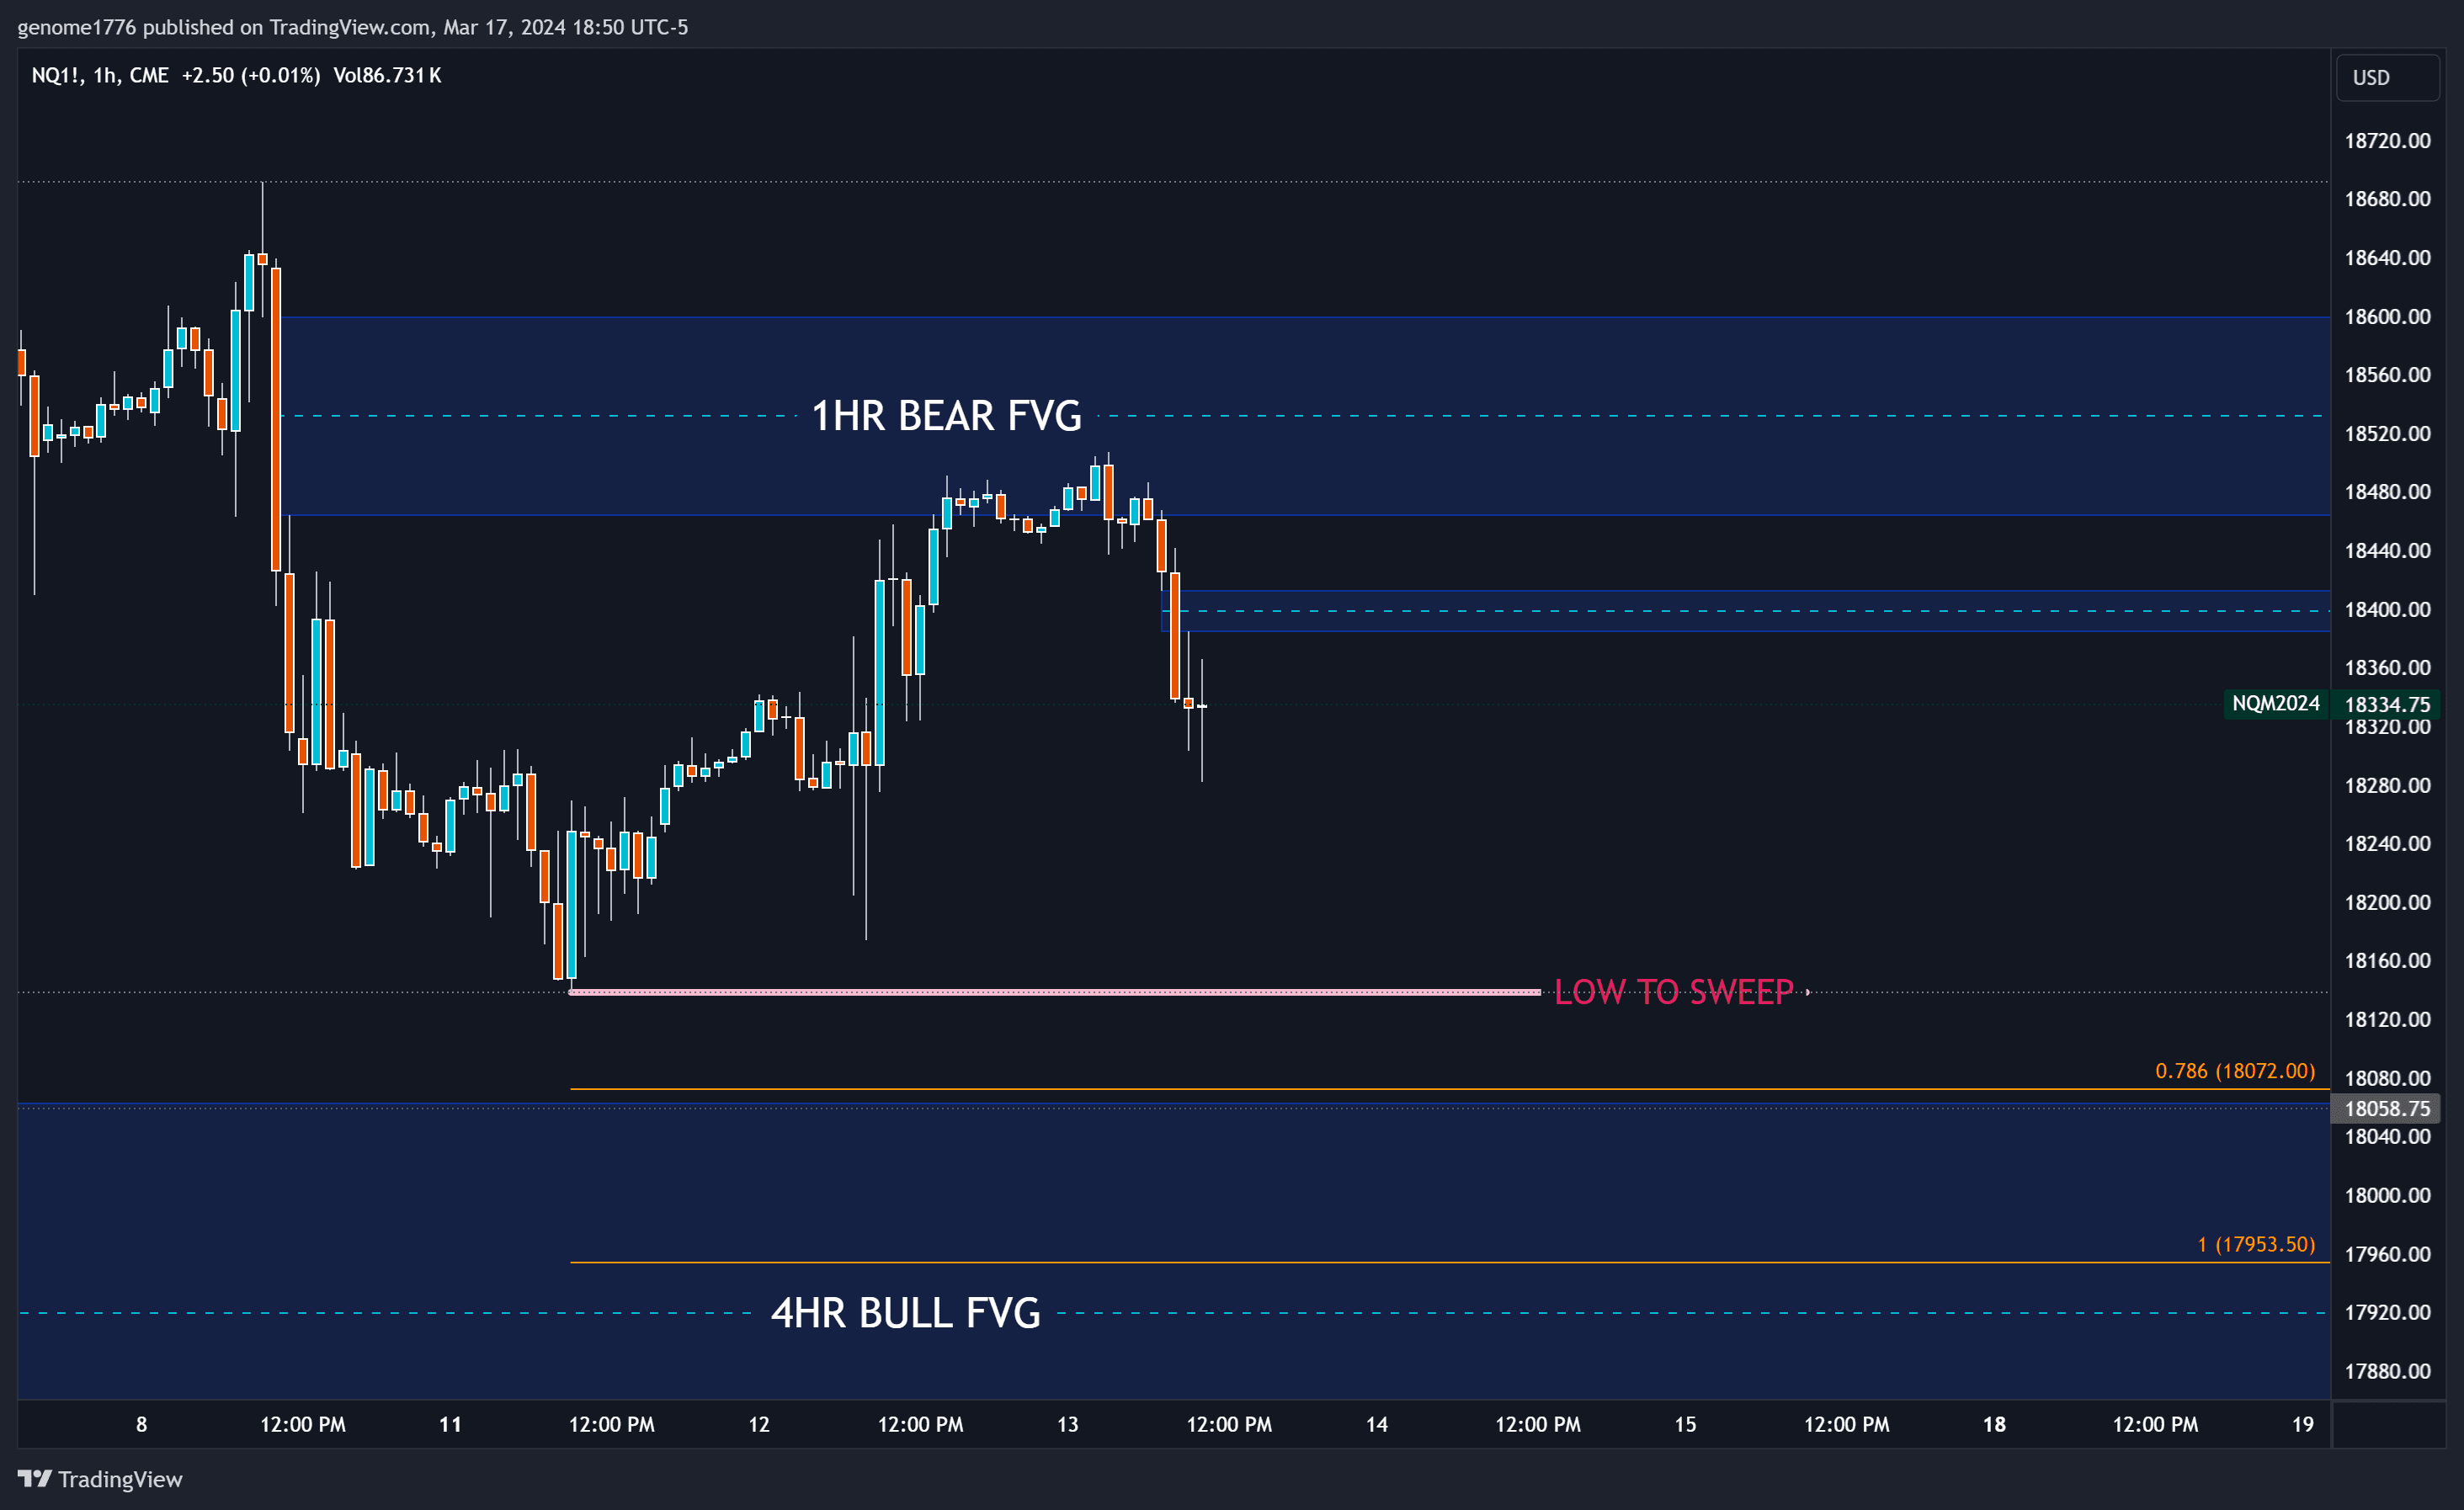
Recapping up to this point, we failed our larger bearish gap at the .618, expecting to sweep the low at 18138.00. We measured the Fibonacci extension from ATH to the first low to the failure at the .618 gap, giving us a 1 Fibonacci target on this higher degree of 17953.50, beautifully just above the middle of a 4-hour gap.
As we further analyzed the waves, we looked for a smaller extension that fits within our expected larger wave pattern. After our most recent FVG was pushed into and then failed hard, we gained another short win of several 100%. Now, with enough data, we confidently drew a Fibonacci extension to help us navigate pivot points.
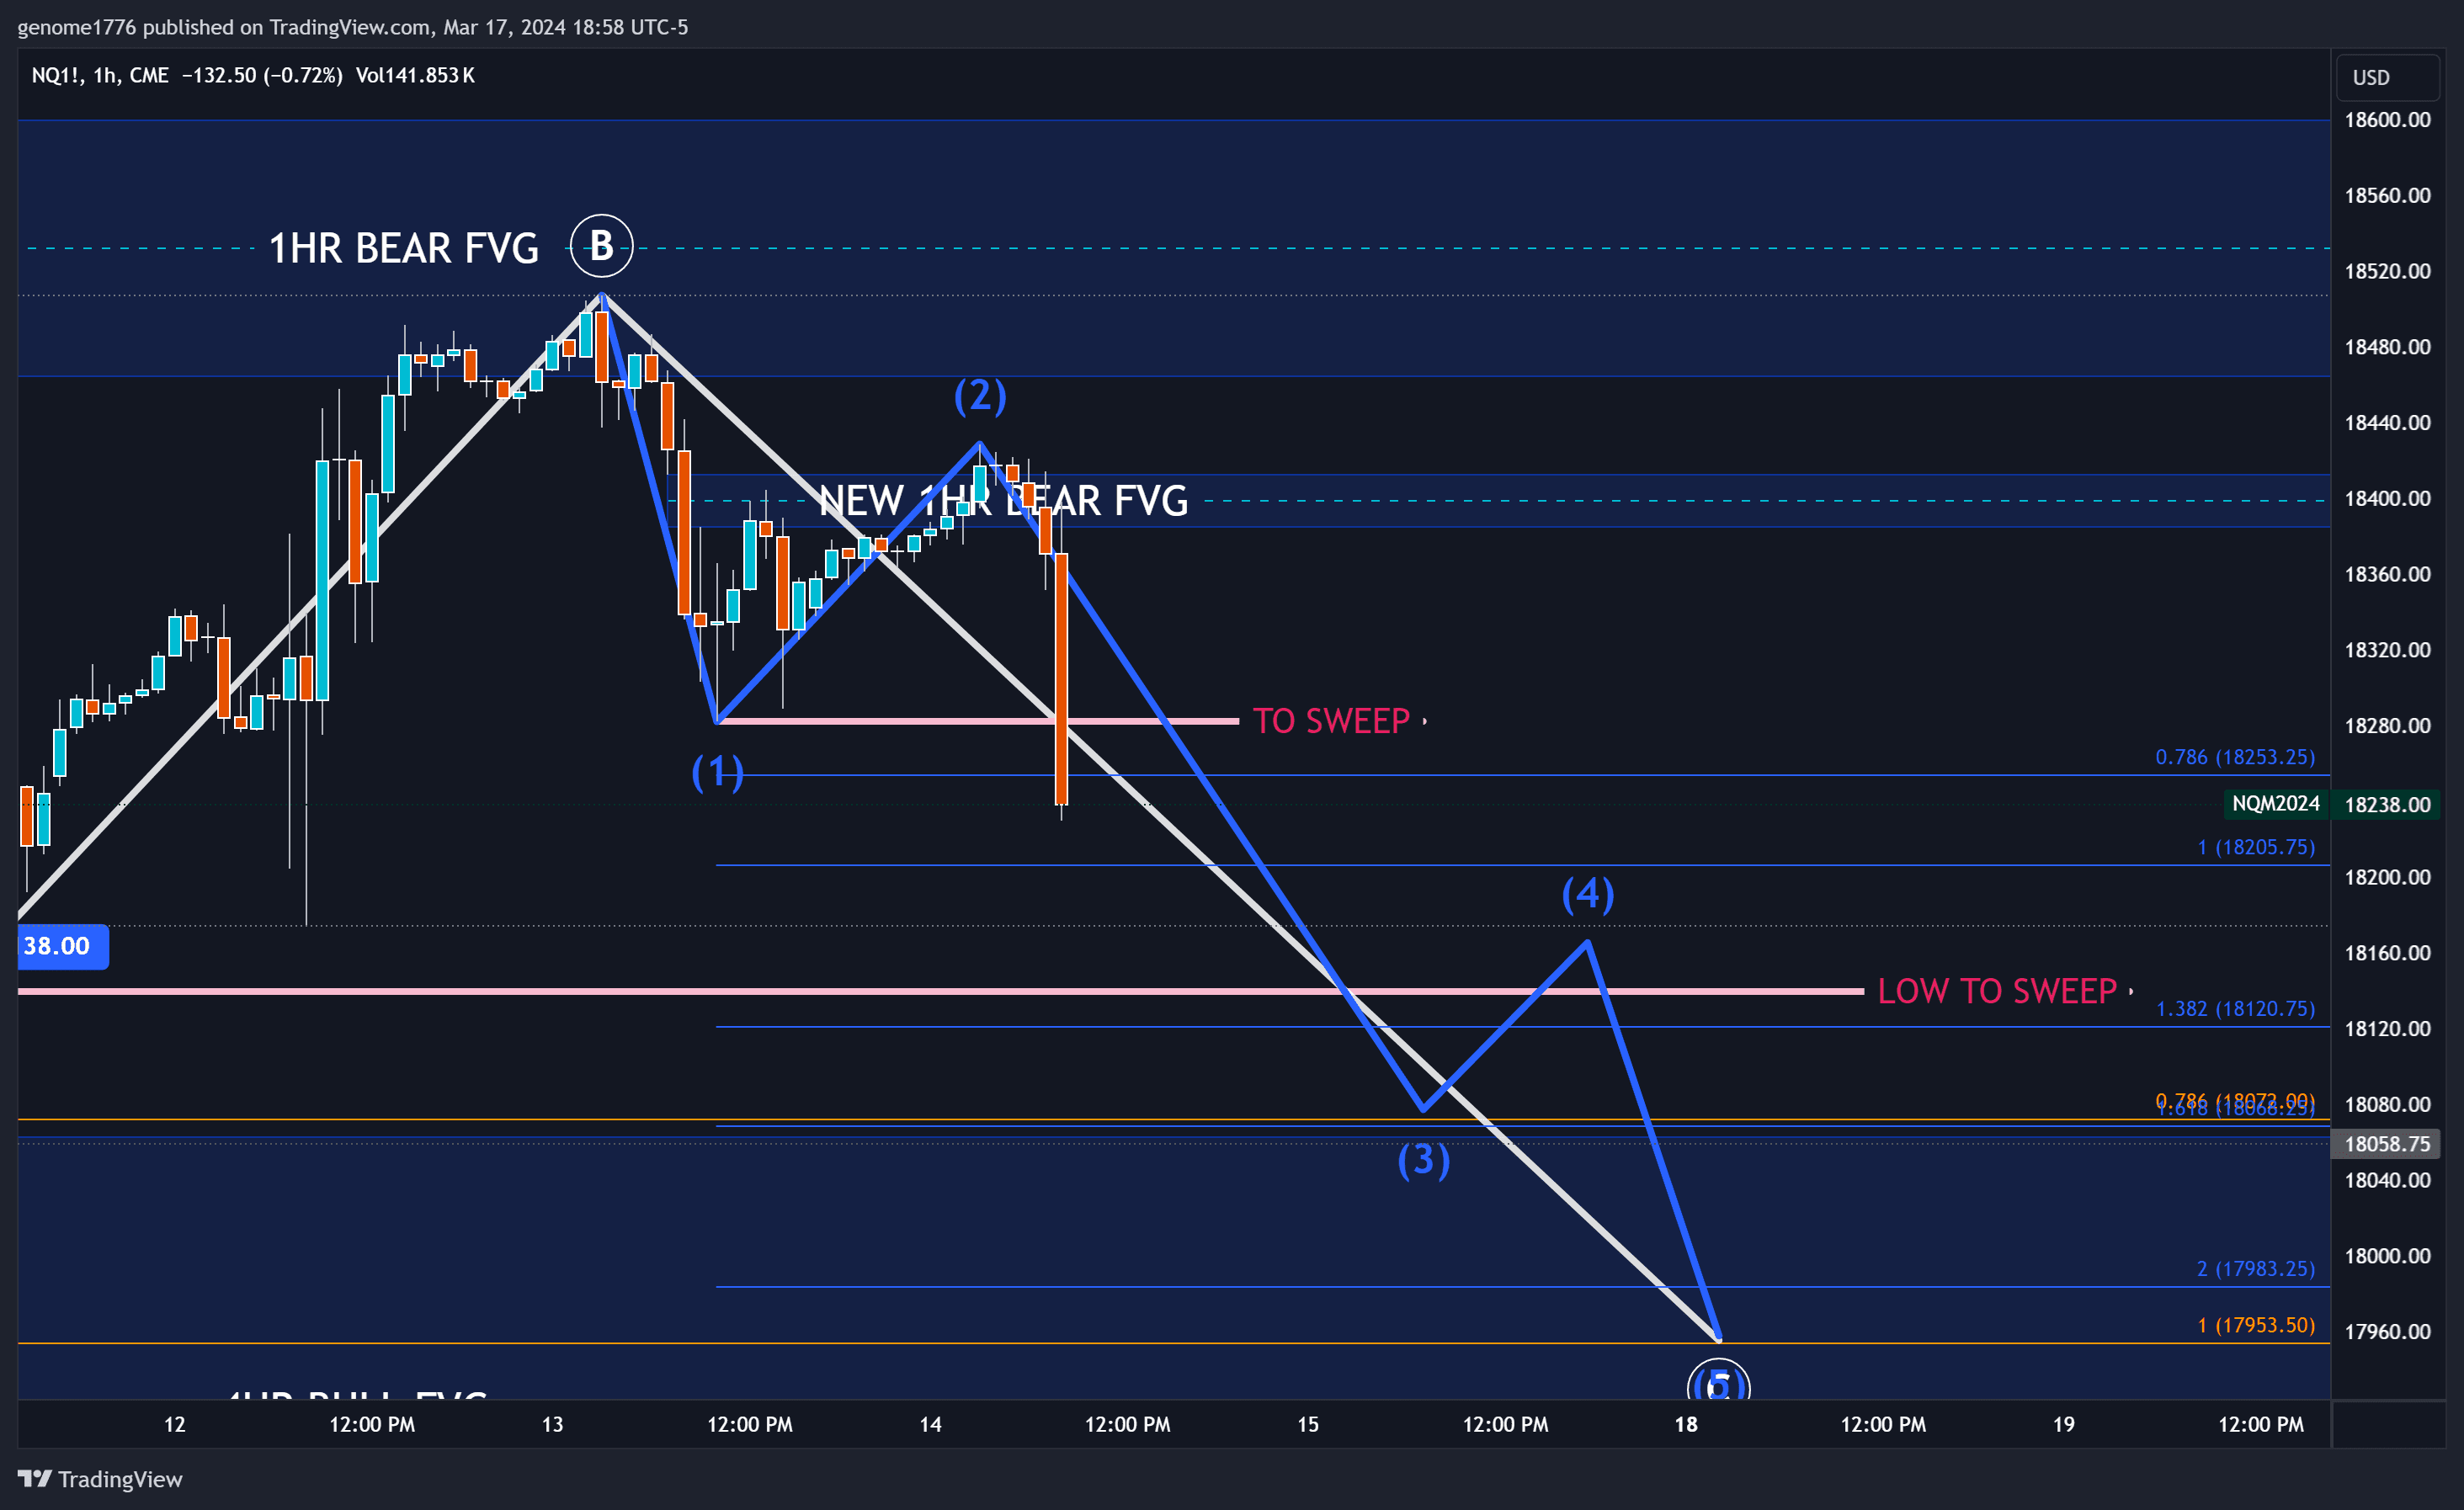
In our analysis, we consistently found strong reactions at the 1 Fibonacci level across various timeframes. We often scalp counter-trend at every 1 Fibonacci level. Although it's about 50/50 whether it pivots and the trend changes entirely here, the additional data provided strong reasons to believe in a continued downward movement to at least sweep the bigger low from the first gap.
During this move down to the smaller timeframe 1 Fibonacci at 18205.75, we set another bearish FVG, expecting a retrace into it, a failure, and new lows, which would break our 1 Fibonacci and give us continuation of the trend to our ultimate target.
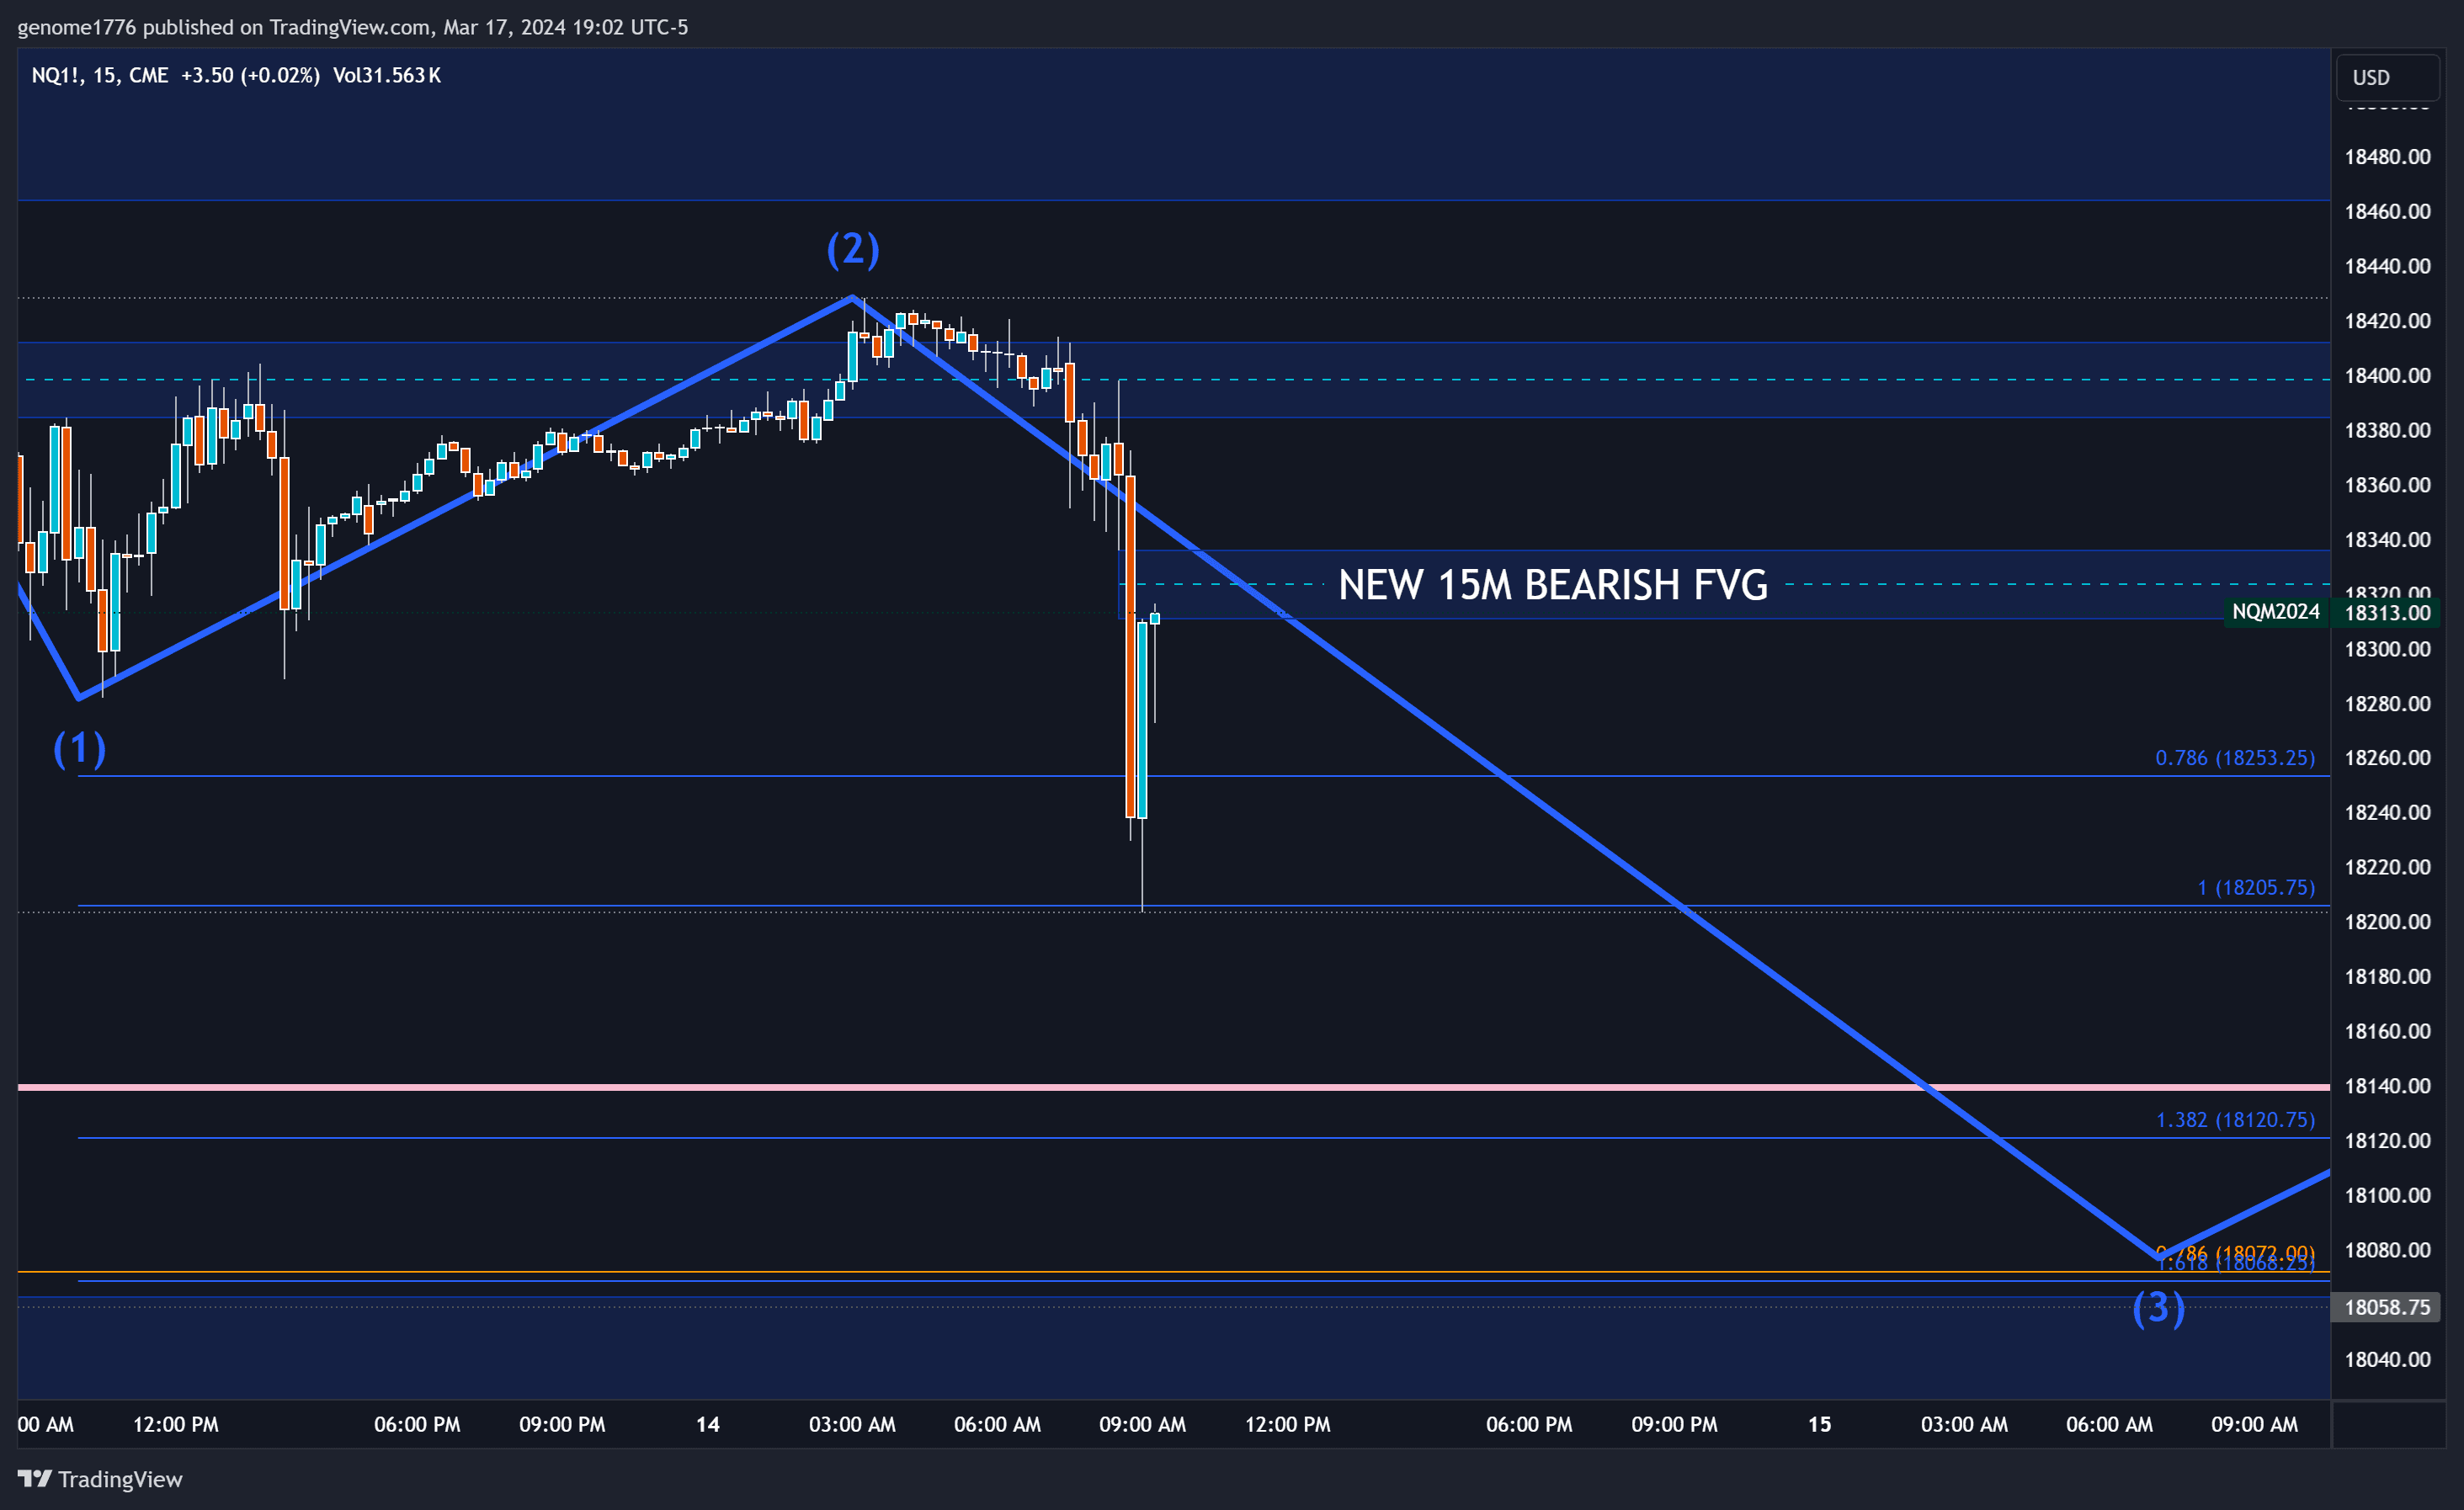
Moving forward, we saw a three-wave move into the 15m gap twice, finally failing the low set at the 1 Fibonacci and giving us a 15m candle close under the 1 Fibonacci as well as new FVGs to play with. This close under the 1 Fibonacci, with four layers of bearish gaps above and no bullish gaps to contend with, led me to 'short the pops' each time on Friday.
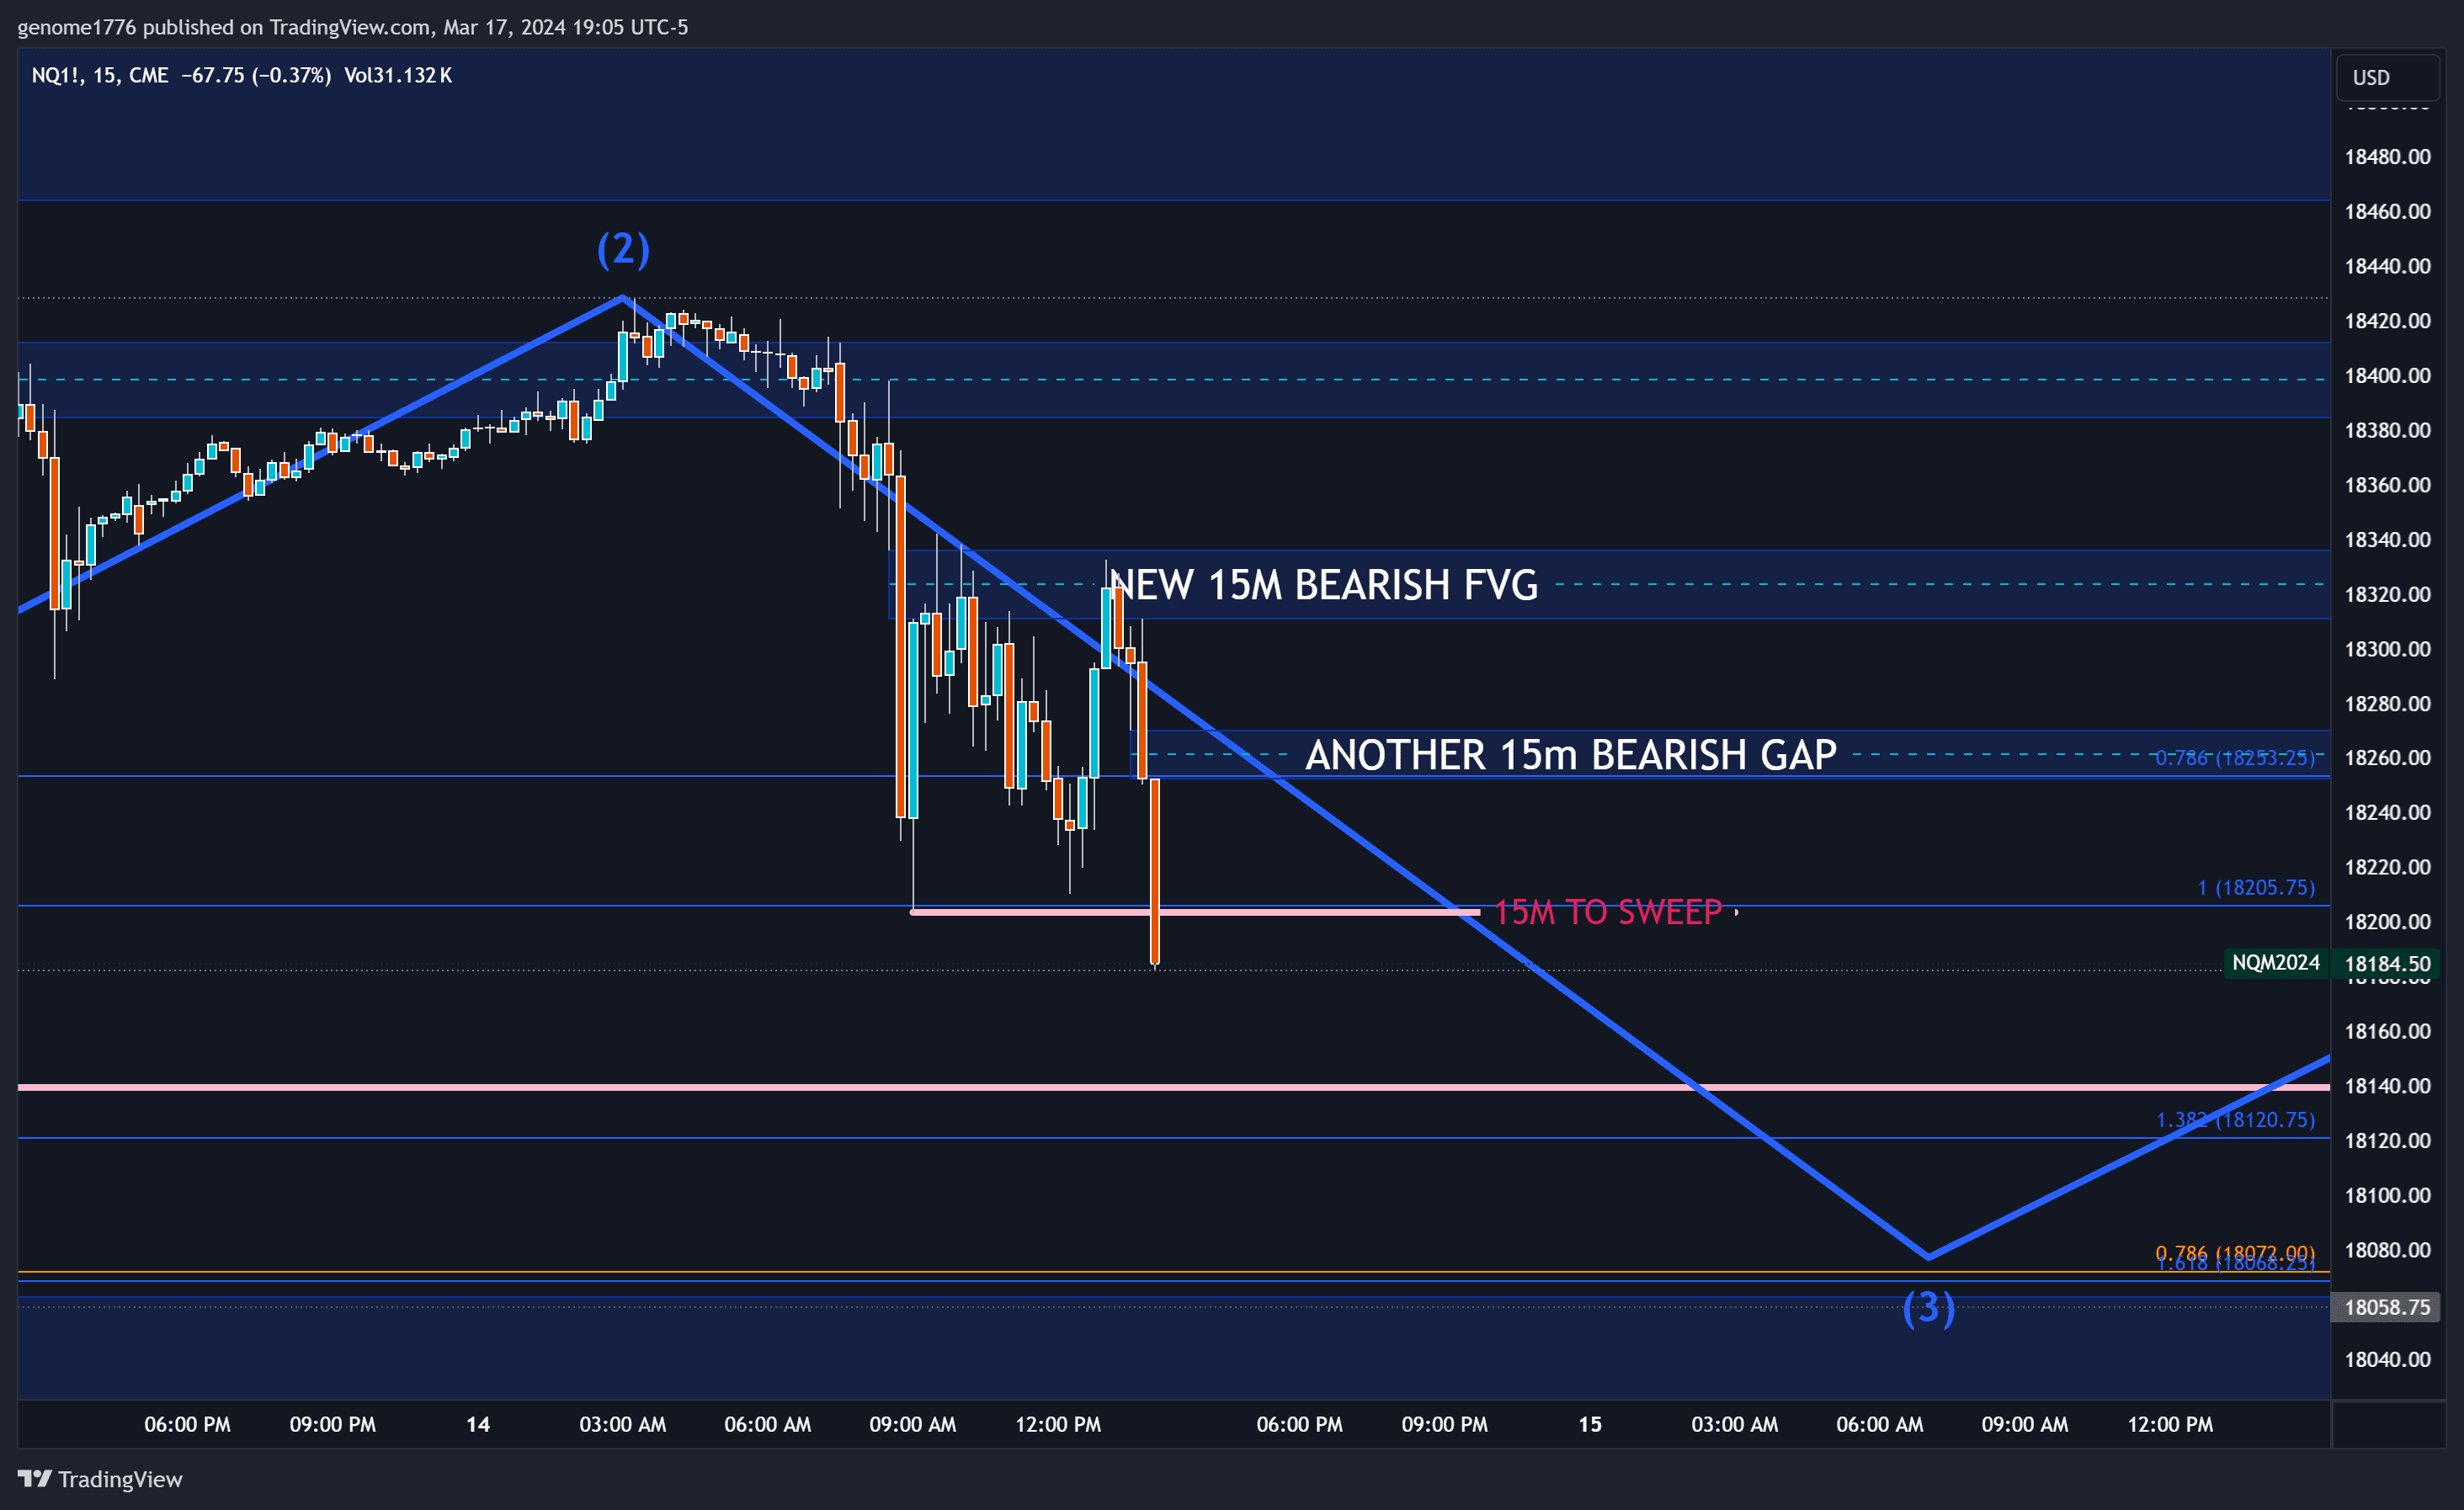
A few hours later, we saw a push into the gap and long wicks forming, failing the gap. Despite the bullish gap we set, it was quickly overrun to fill the gap before proceeding with the actual downward direction.
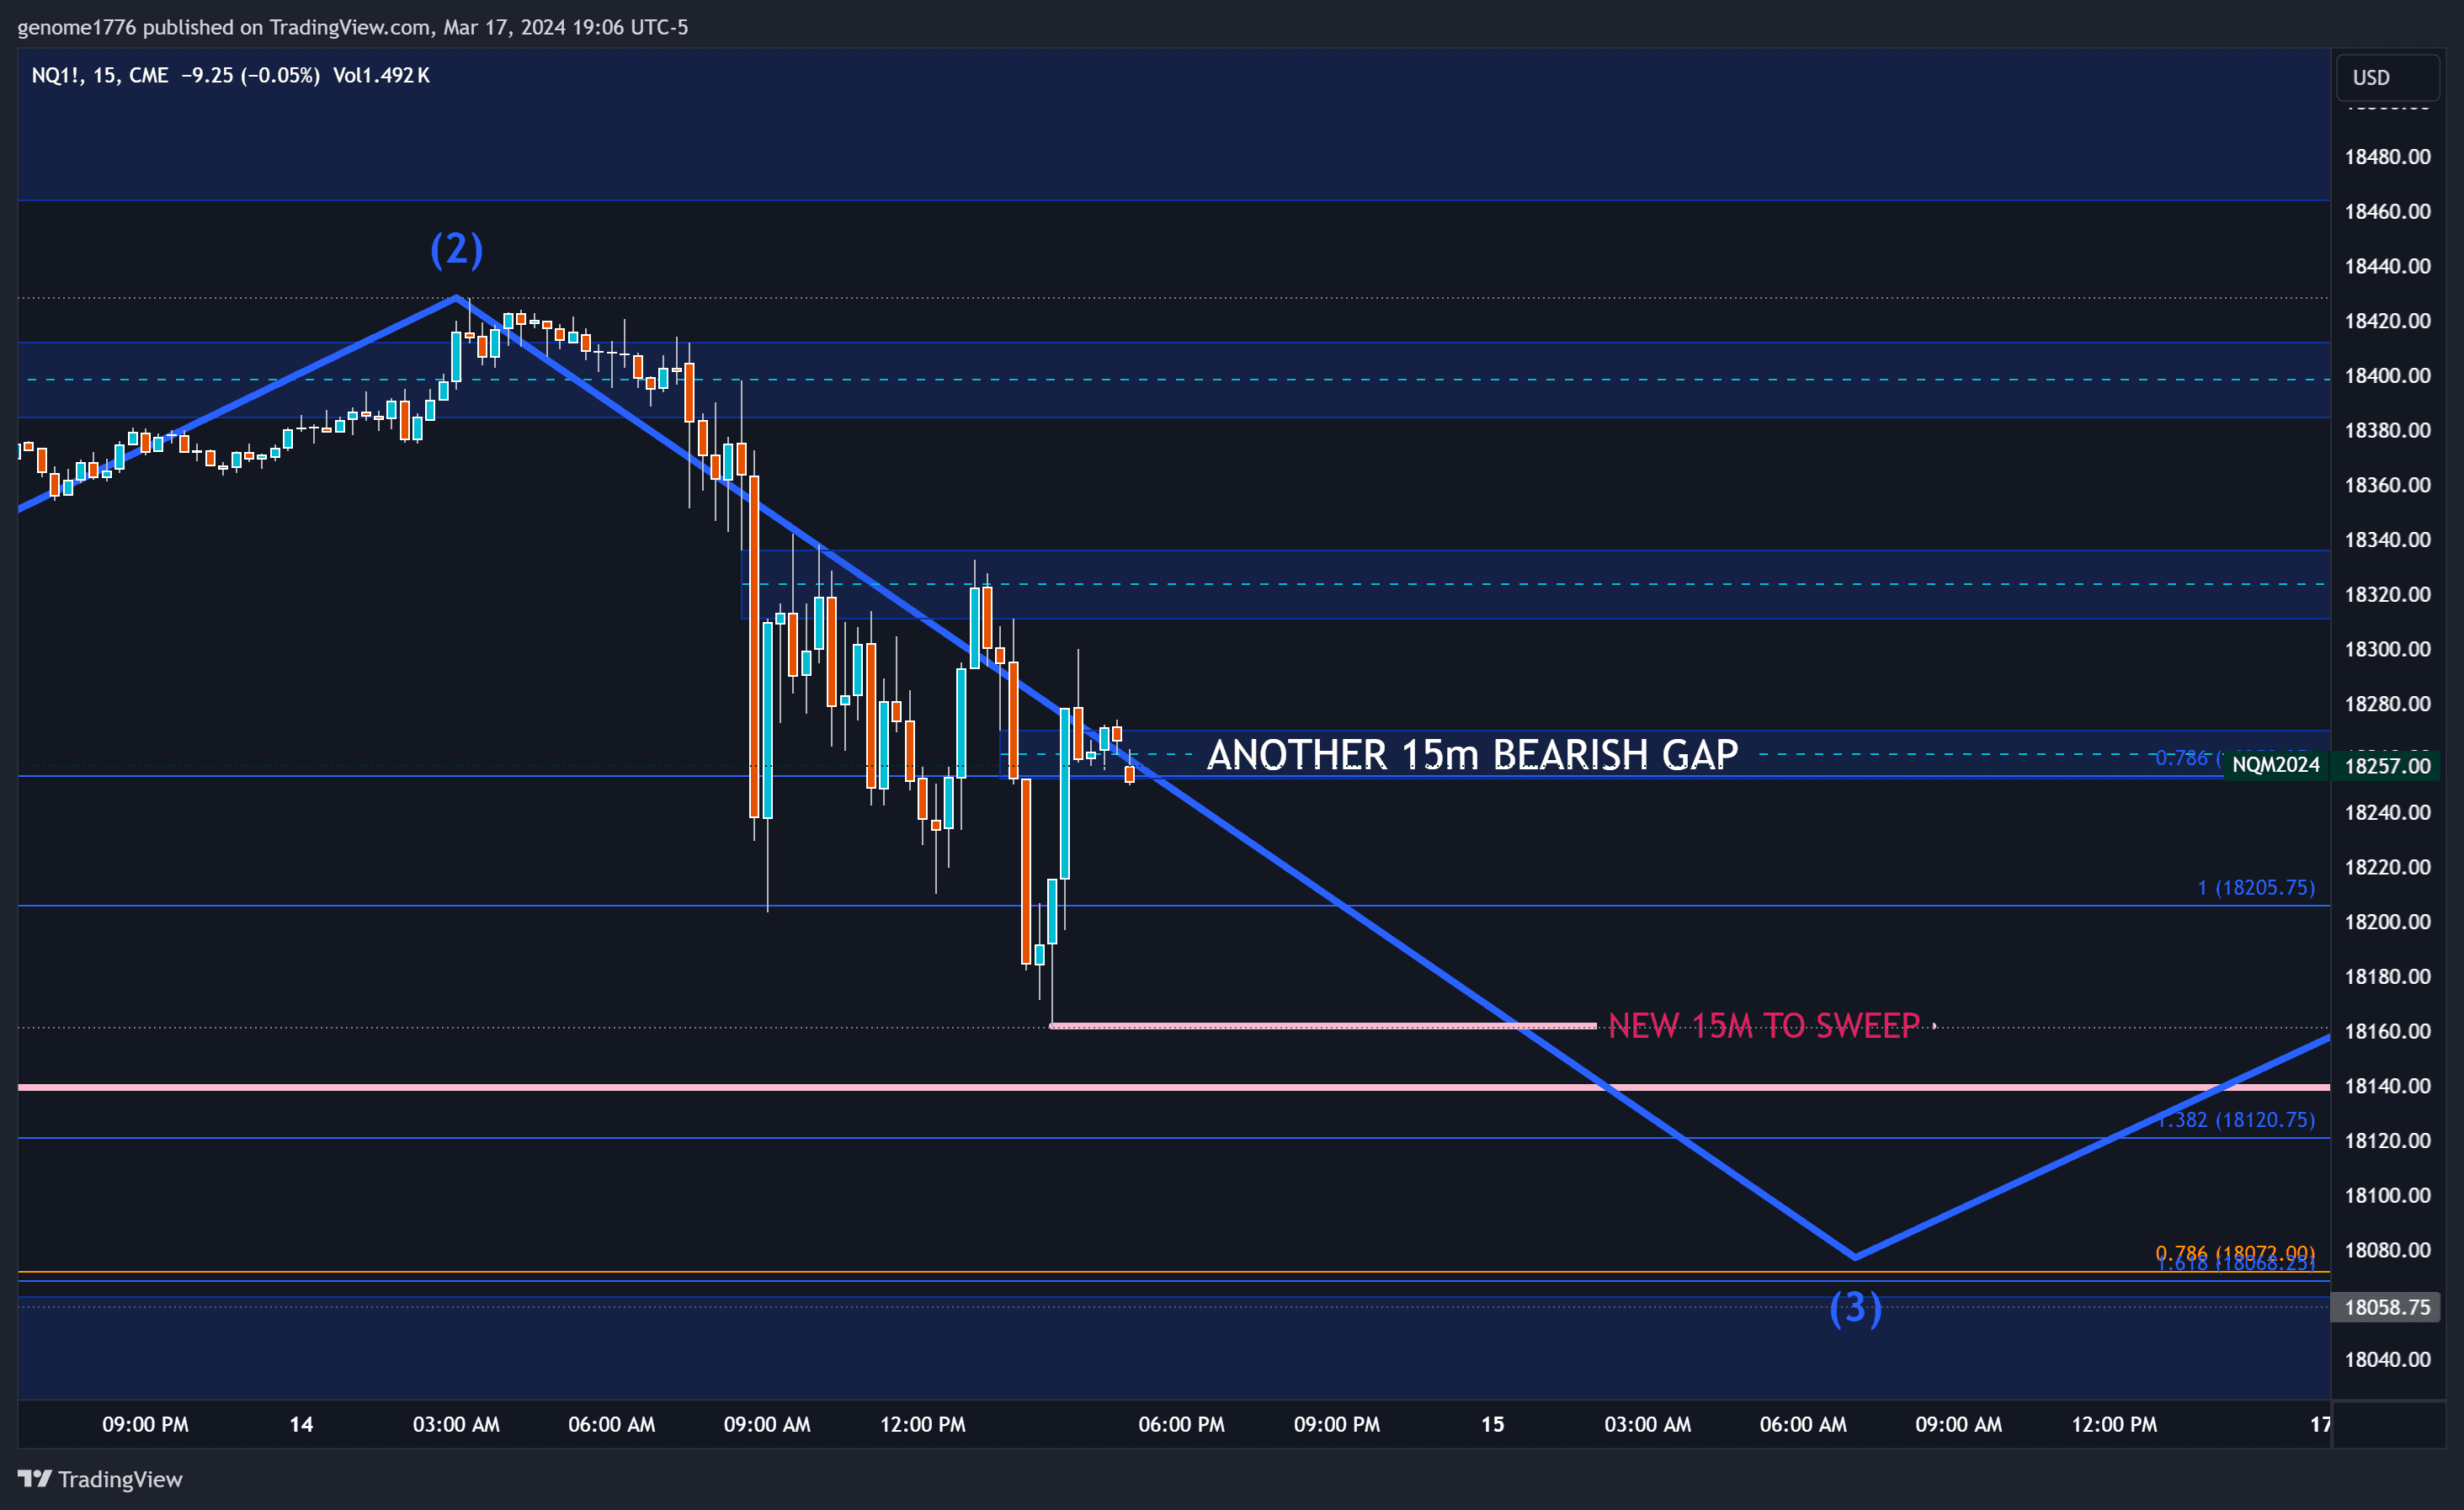
What happened overnight was surprising but not alarming. We experienced a three-wave move back into the upper FVG, a common occurrence. Knowing we had two downside targets to fill and a Fibonacci level beneath us that I expected to hit on a larger degree made it an easy call to go short, expecting to complete our wave 3 of C.
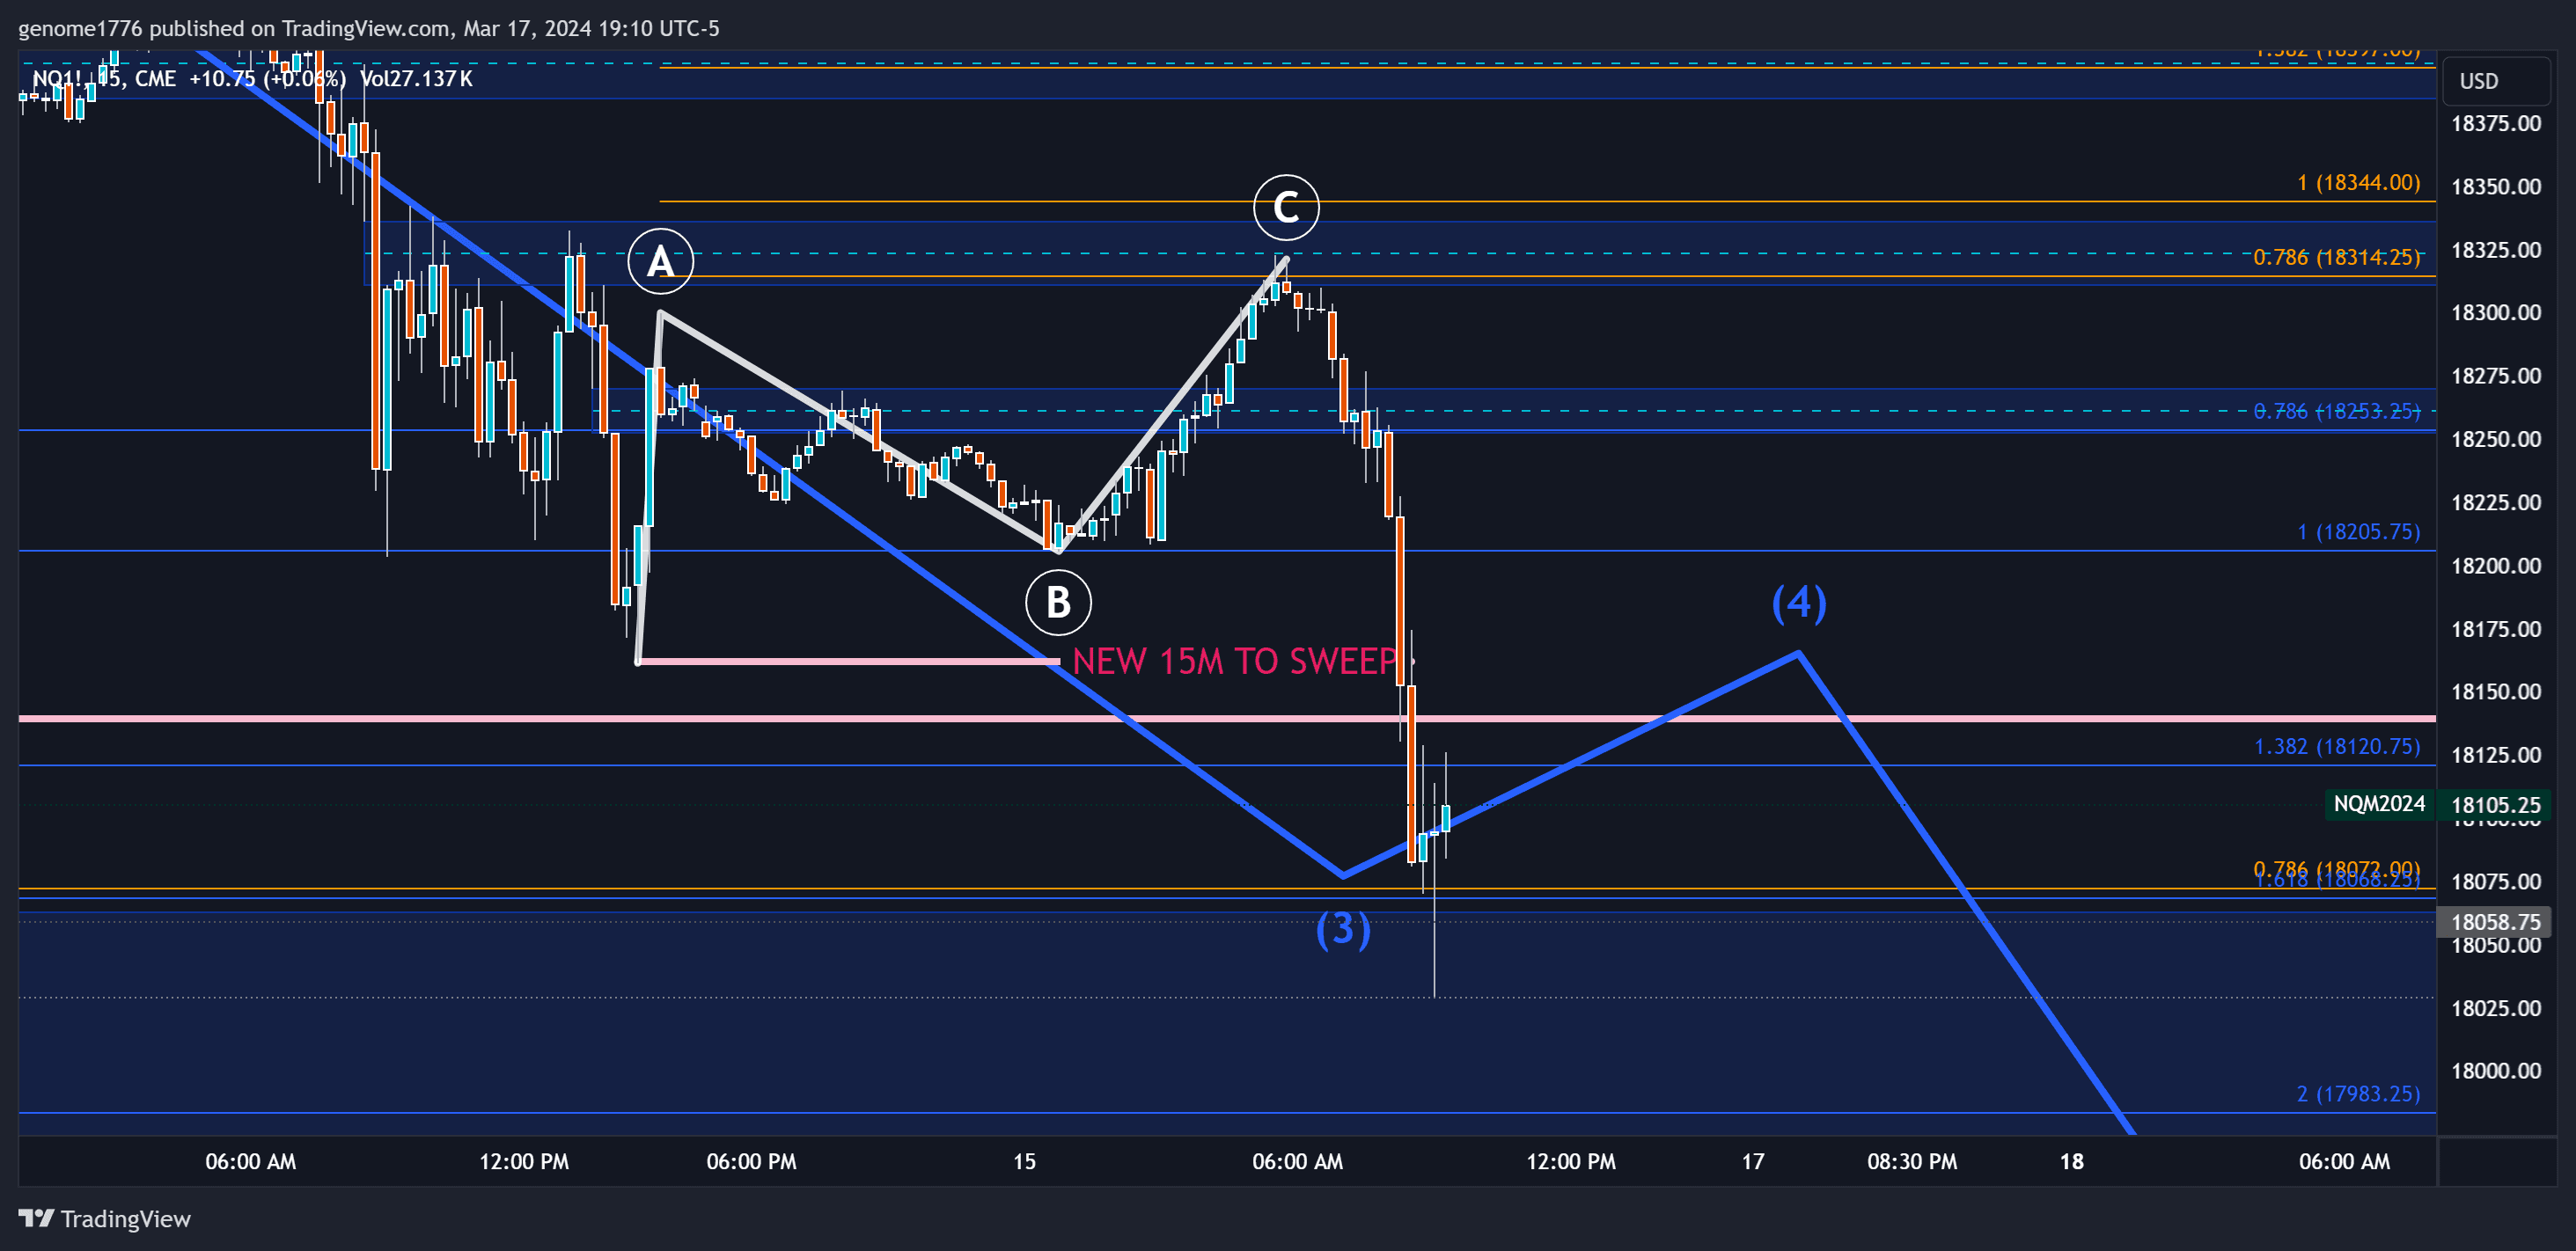
A few bars later, we filled the 1.618 and wicked out of it perfectly, prompting me to call for 'Chop the rest of the day,' a straightforward and correct prediction. This was due to our position in wave 4, which is always uneventful. The fact that it was Friday, a day known for one good move followed by choppiness, supported this call, especially on quad witching.
I hope all this information on how I think about price movement, gaps, waves, and Fibonacci levels helps you all understand my system and my ability to call pivots and achieve significant success.
All praise to Jesus, for without Him, none of this matters. Prayer, worship, and constant seeking of wisdom are the true keys to elevating your life.